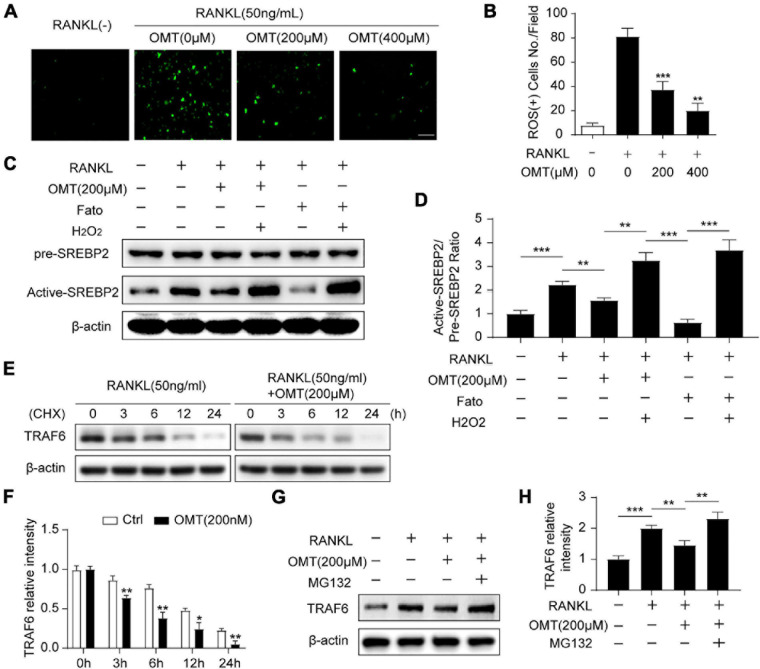
FIGURE 4.
OMT inhibits SREBP2 activation via down-regulating ROS levels during osteoclastogenesis. (A) BMMs were treated with RANKL and different concentrations of OMT for 3 days, DCFH-DA was used to examine the intracellular ROS levels and representative images were shown. Scale bar = 100 μm. (B) Quantification of ROS-positive cell numbers per field (n = 5 per group). (C) BMMs were treated with RANKL, OMT, Fatostatin (Fato), and H2O2 as indicated, the level of pre-SREBP2 and active-SREBP2 was detected with western blots. (D) Quantification of the ratios of band intensity of active-SREBP2 relative to pre-SREBP2 (n = 3 per group). (E) BMMs were treated with or without 200 μM OMT in the presence of RANKL, and cultured with CHX for the indicated hours, the level of TRAF6 was examined by western blots. (F) Quantification of the ratios of band intensity of TRAF6 relative to β-actin (n = 3 per group). (G) TRAF6 expression in BMMs incubated with the proteasomal inhibitor MG 132 in the presence or absence of RANKL and OMT. (H) Quantification of the ratios of band intensity of TRAF6 relative to β-actin (n = 3 per group). Data were presented as means ± SD. *p < 0.05, **p < 0.01, ***p < 0.001.

