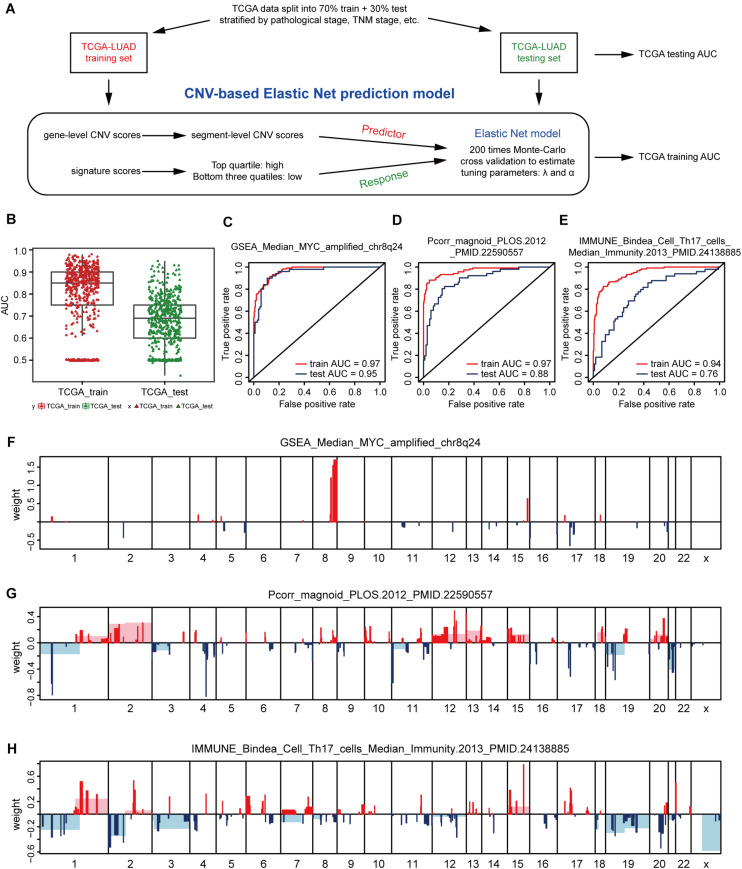
FIGURE 2.
CNV-based gene signature prediction. (A) Schematic overview of the strategy used to build Elastic Net regression models for predicting gene expression signature levels. (B) AUC distributions of CNV-based prediction for the 531 gene signature scores of lung adenocarcinoma in the TCGA training and test set. (C–E) ROC curves and corresponding AUC values for three signatures in the training and test sets. GSEA_Median_MYC_amplified_chr8q24 (C), Pcorr_magnoid_PLOS.2012 (D), and IMMUNE_Bindea_Cell_Th17_cells_Median_Immunity.2013 (E). (F–H) CNV segments and whole chromosomal arms and their corresponding coefficients selected by the Elastic Net prediction models for the three signatures.

