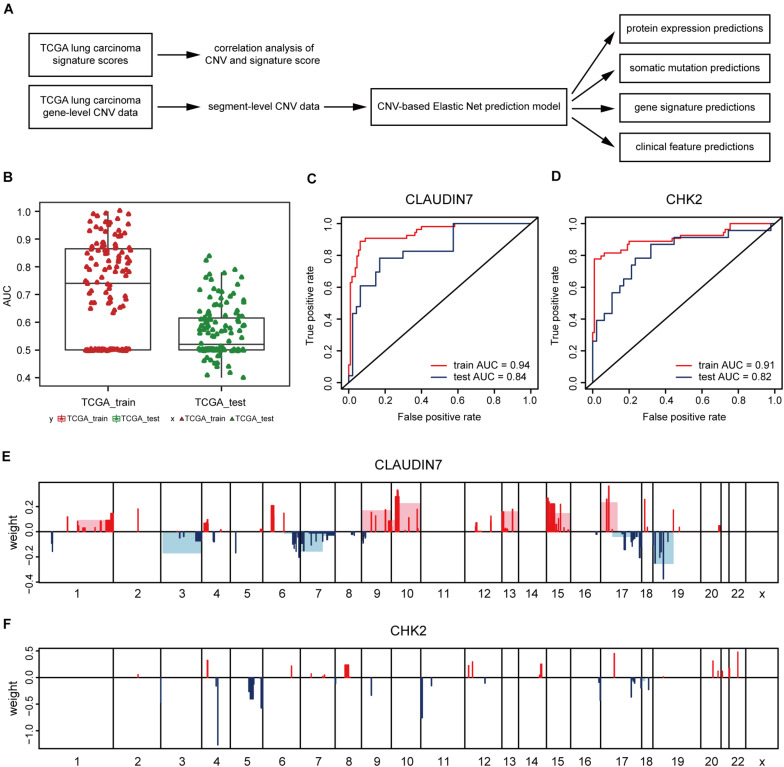
FIGURE 3.
CNV-based protein expression prediction. (A) Flowchart showed the construction of CNV-based Elastic Net prediction models and the certification of its predictive value on gene expression, protein, mutation and clinical features. (B) AUC distributions of CNV-based expression level predictions for 131 proteins in the RPPA arrays. (C,D) ROC curves and corresponding AUC values of Claudin7 (C) and CHK2 (D) in the TCGA training and test sets. (E,F) Elastic Net-selected CNV segments and whole chromosomal arms and their coefficients for prediction models for the two proteins.

