FIGURE 5.
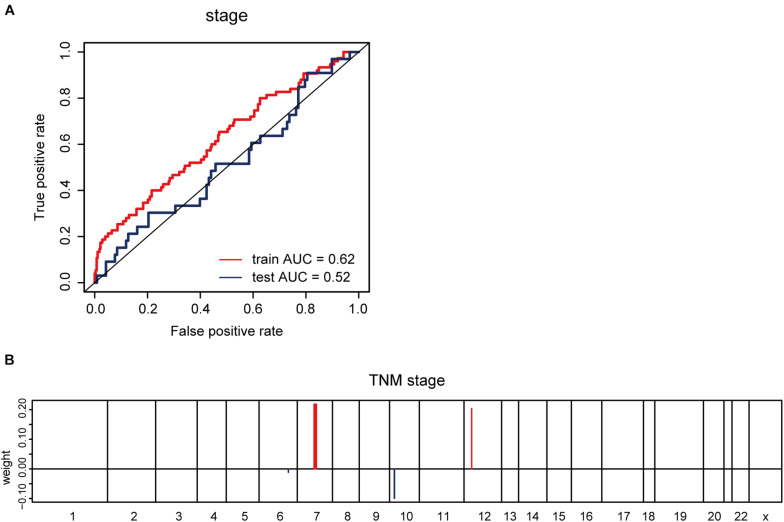
CNV-based prediction of clinical features. (A) ROC curves and corresponding AUC values for CNV-based prediction of clinical stage (stage I–II vs. stage III–IV) in the TCGA training and test sets. (B) Elastic Net-selected CNV segments and whole chromosomal arms and their coefficients for prediction model for pathological stage.

