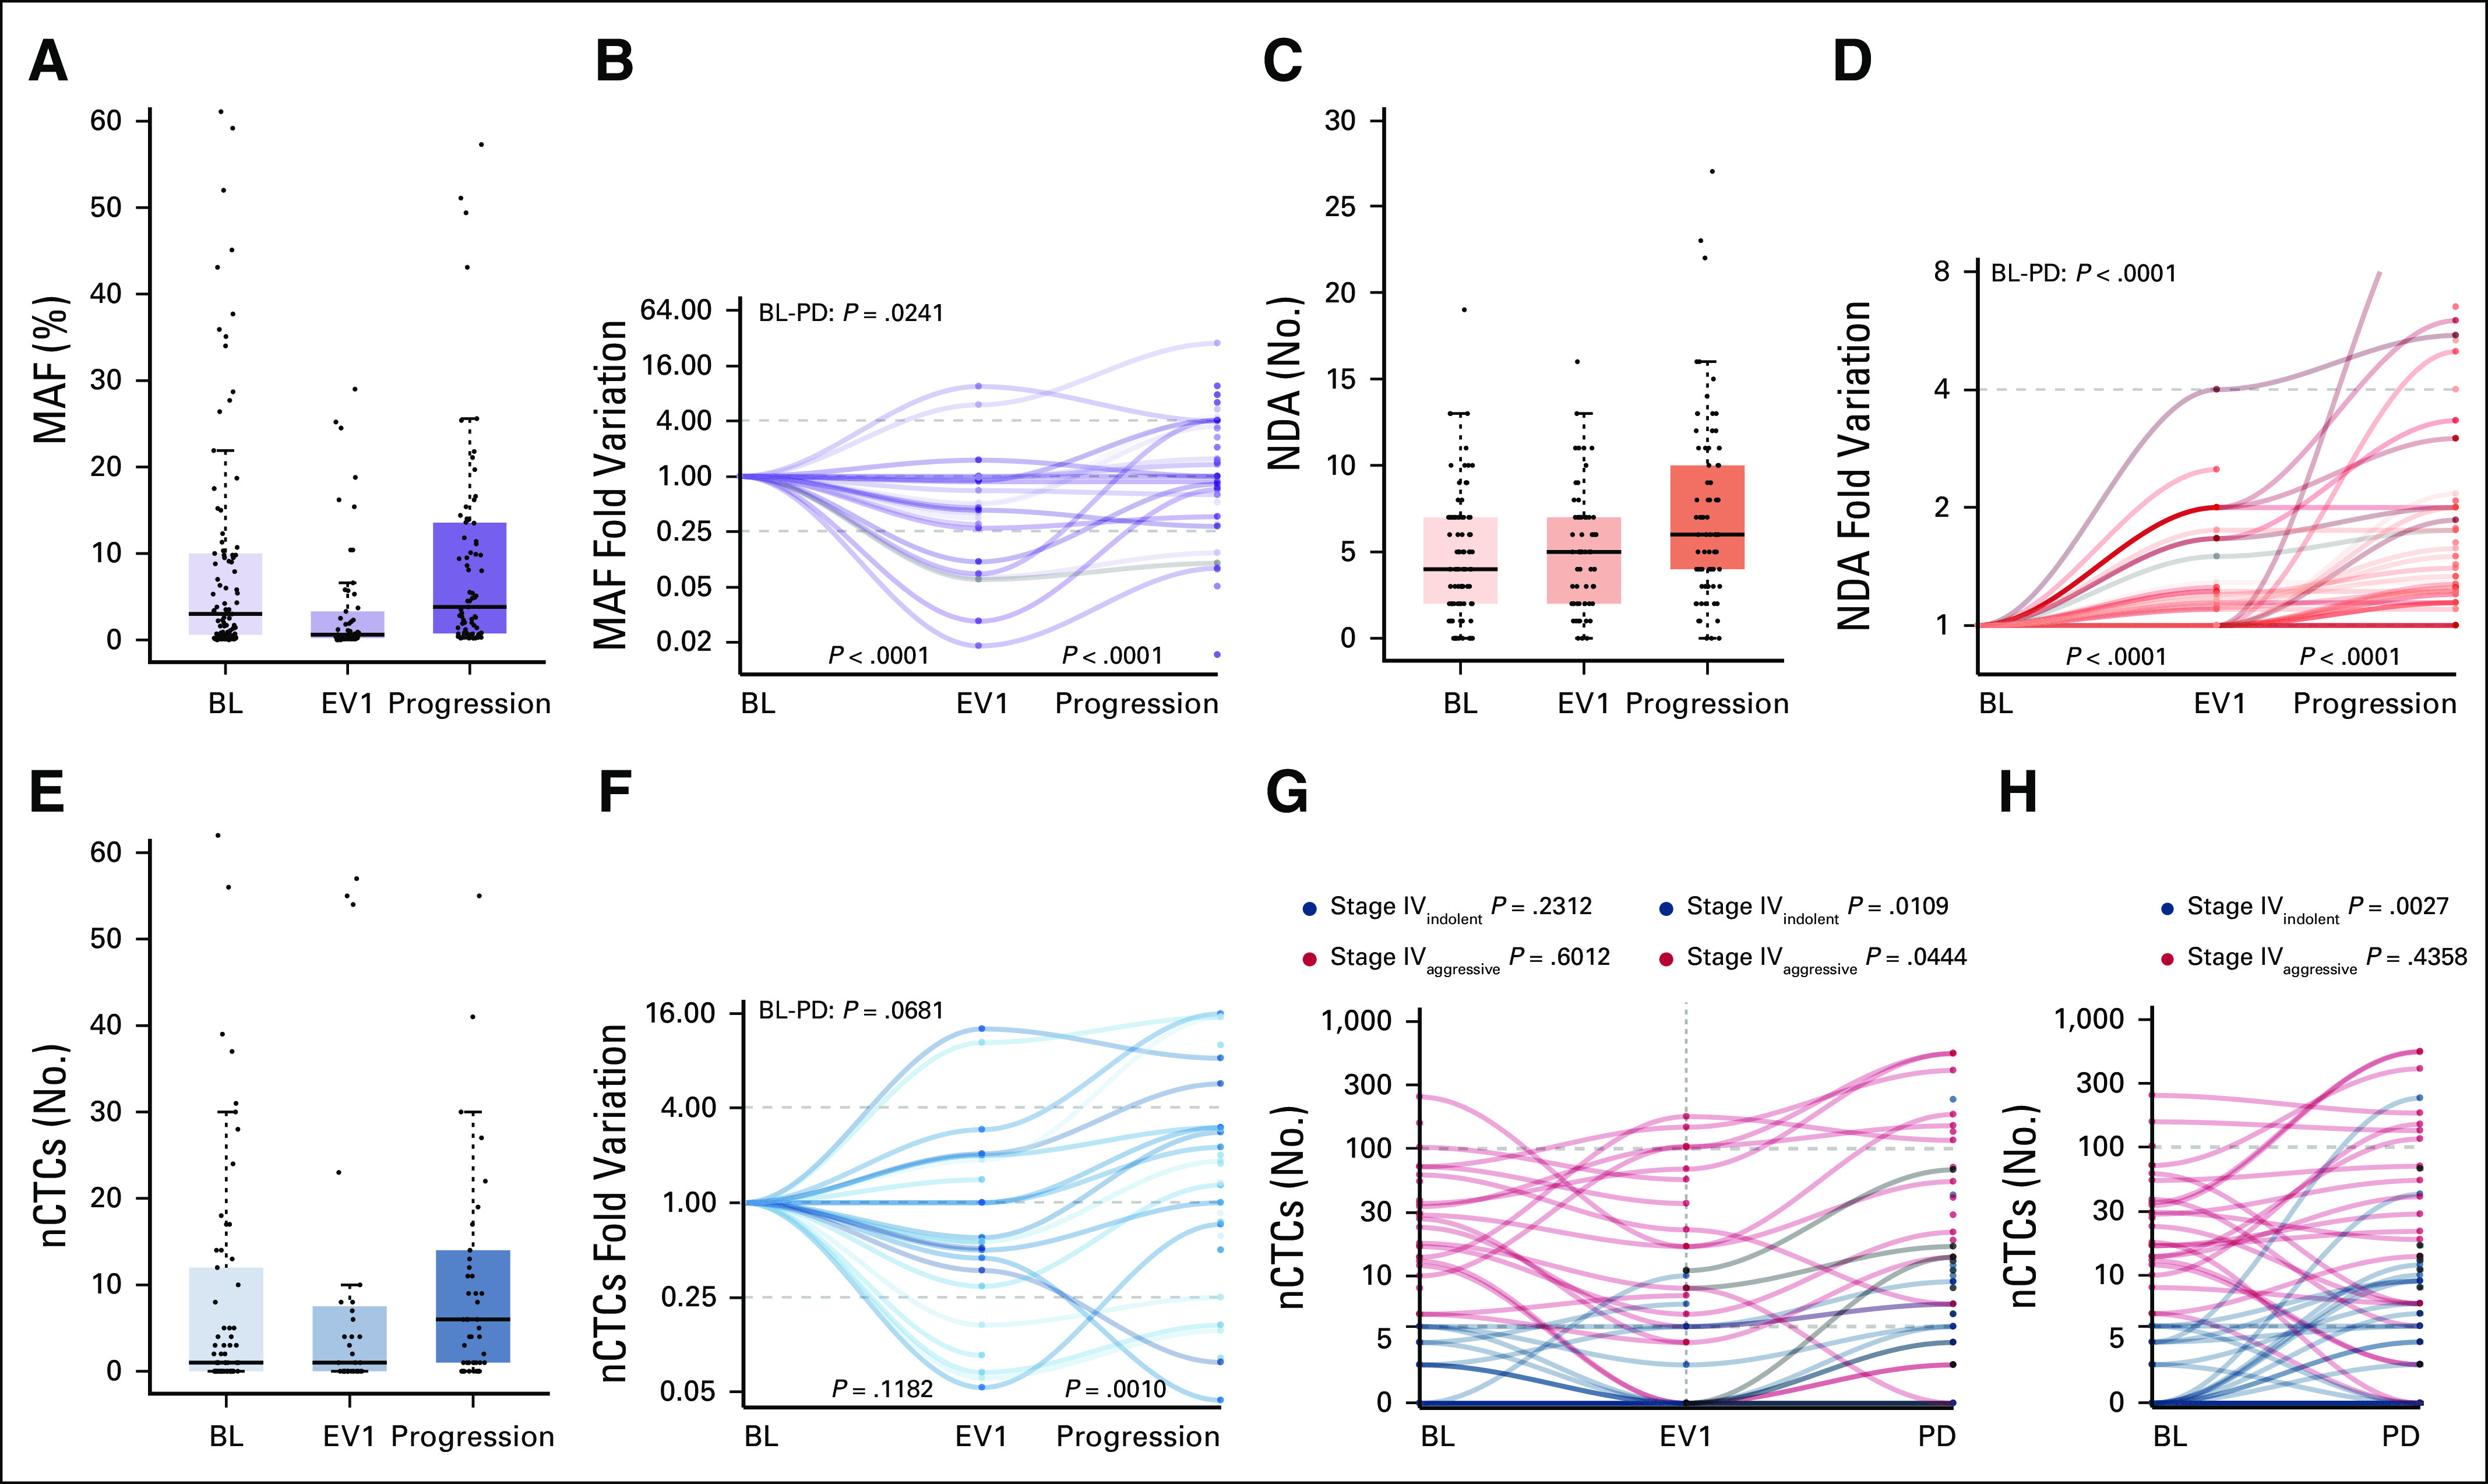
FIG 1.

MAF, NDA, and nCTCs distribution and dynamics across the three investigated timepoints (BL, first clinical evaluation [EV1], and progression) and nCTCs dynamics across the three investigated timepoints according to BL CTCs status (stage IVindolent v stage IVaggressive) (G and H). (A, C, and E) Median, interquartile range, and outliers are described for the overall biomarker distribution at each timepoint through box and whiskers plots. (B, D, and F) Biomarker dynamics was then plotted for each patient. MAF initially decreased between BL and EV1, whereas it increased at progression (P < .0001). This trend was observed both in the (A) overall distribution and (B) at a single patient's level normalized on the BL levels. NDA had a steady increase across all timepoints (P < .0001) in the (C) general cohort and (D) at a single patient's level. (E) nCTCs did not vary significantly at EV1 (P = .1182) and it generally increased significantly at progression (P = .0010), (F) although some patients experienced a decrease. In the stage IVaggressive subgroup, (G) a significant increase was observed only between EV1 and progression (P = .0444), and a significant increase was observed in the stage IVindolent subgroup both (G) between EV1 and progression (P = .0109) and (H) BL and PD (P = .0027). (G) No significant differences were observed in either subgroup between BL or EV1. BL, baseline; CTC, circulating tumor cell; EV1, evaluation one; MAF, mutant allele frequency; nCTC, circulating tumor cell enumeration; NDA, number of detected alteration; PD, progressive disease.
