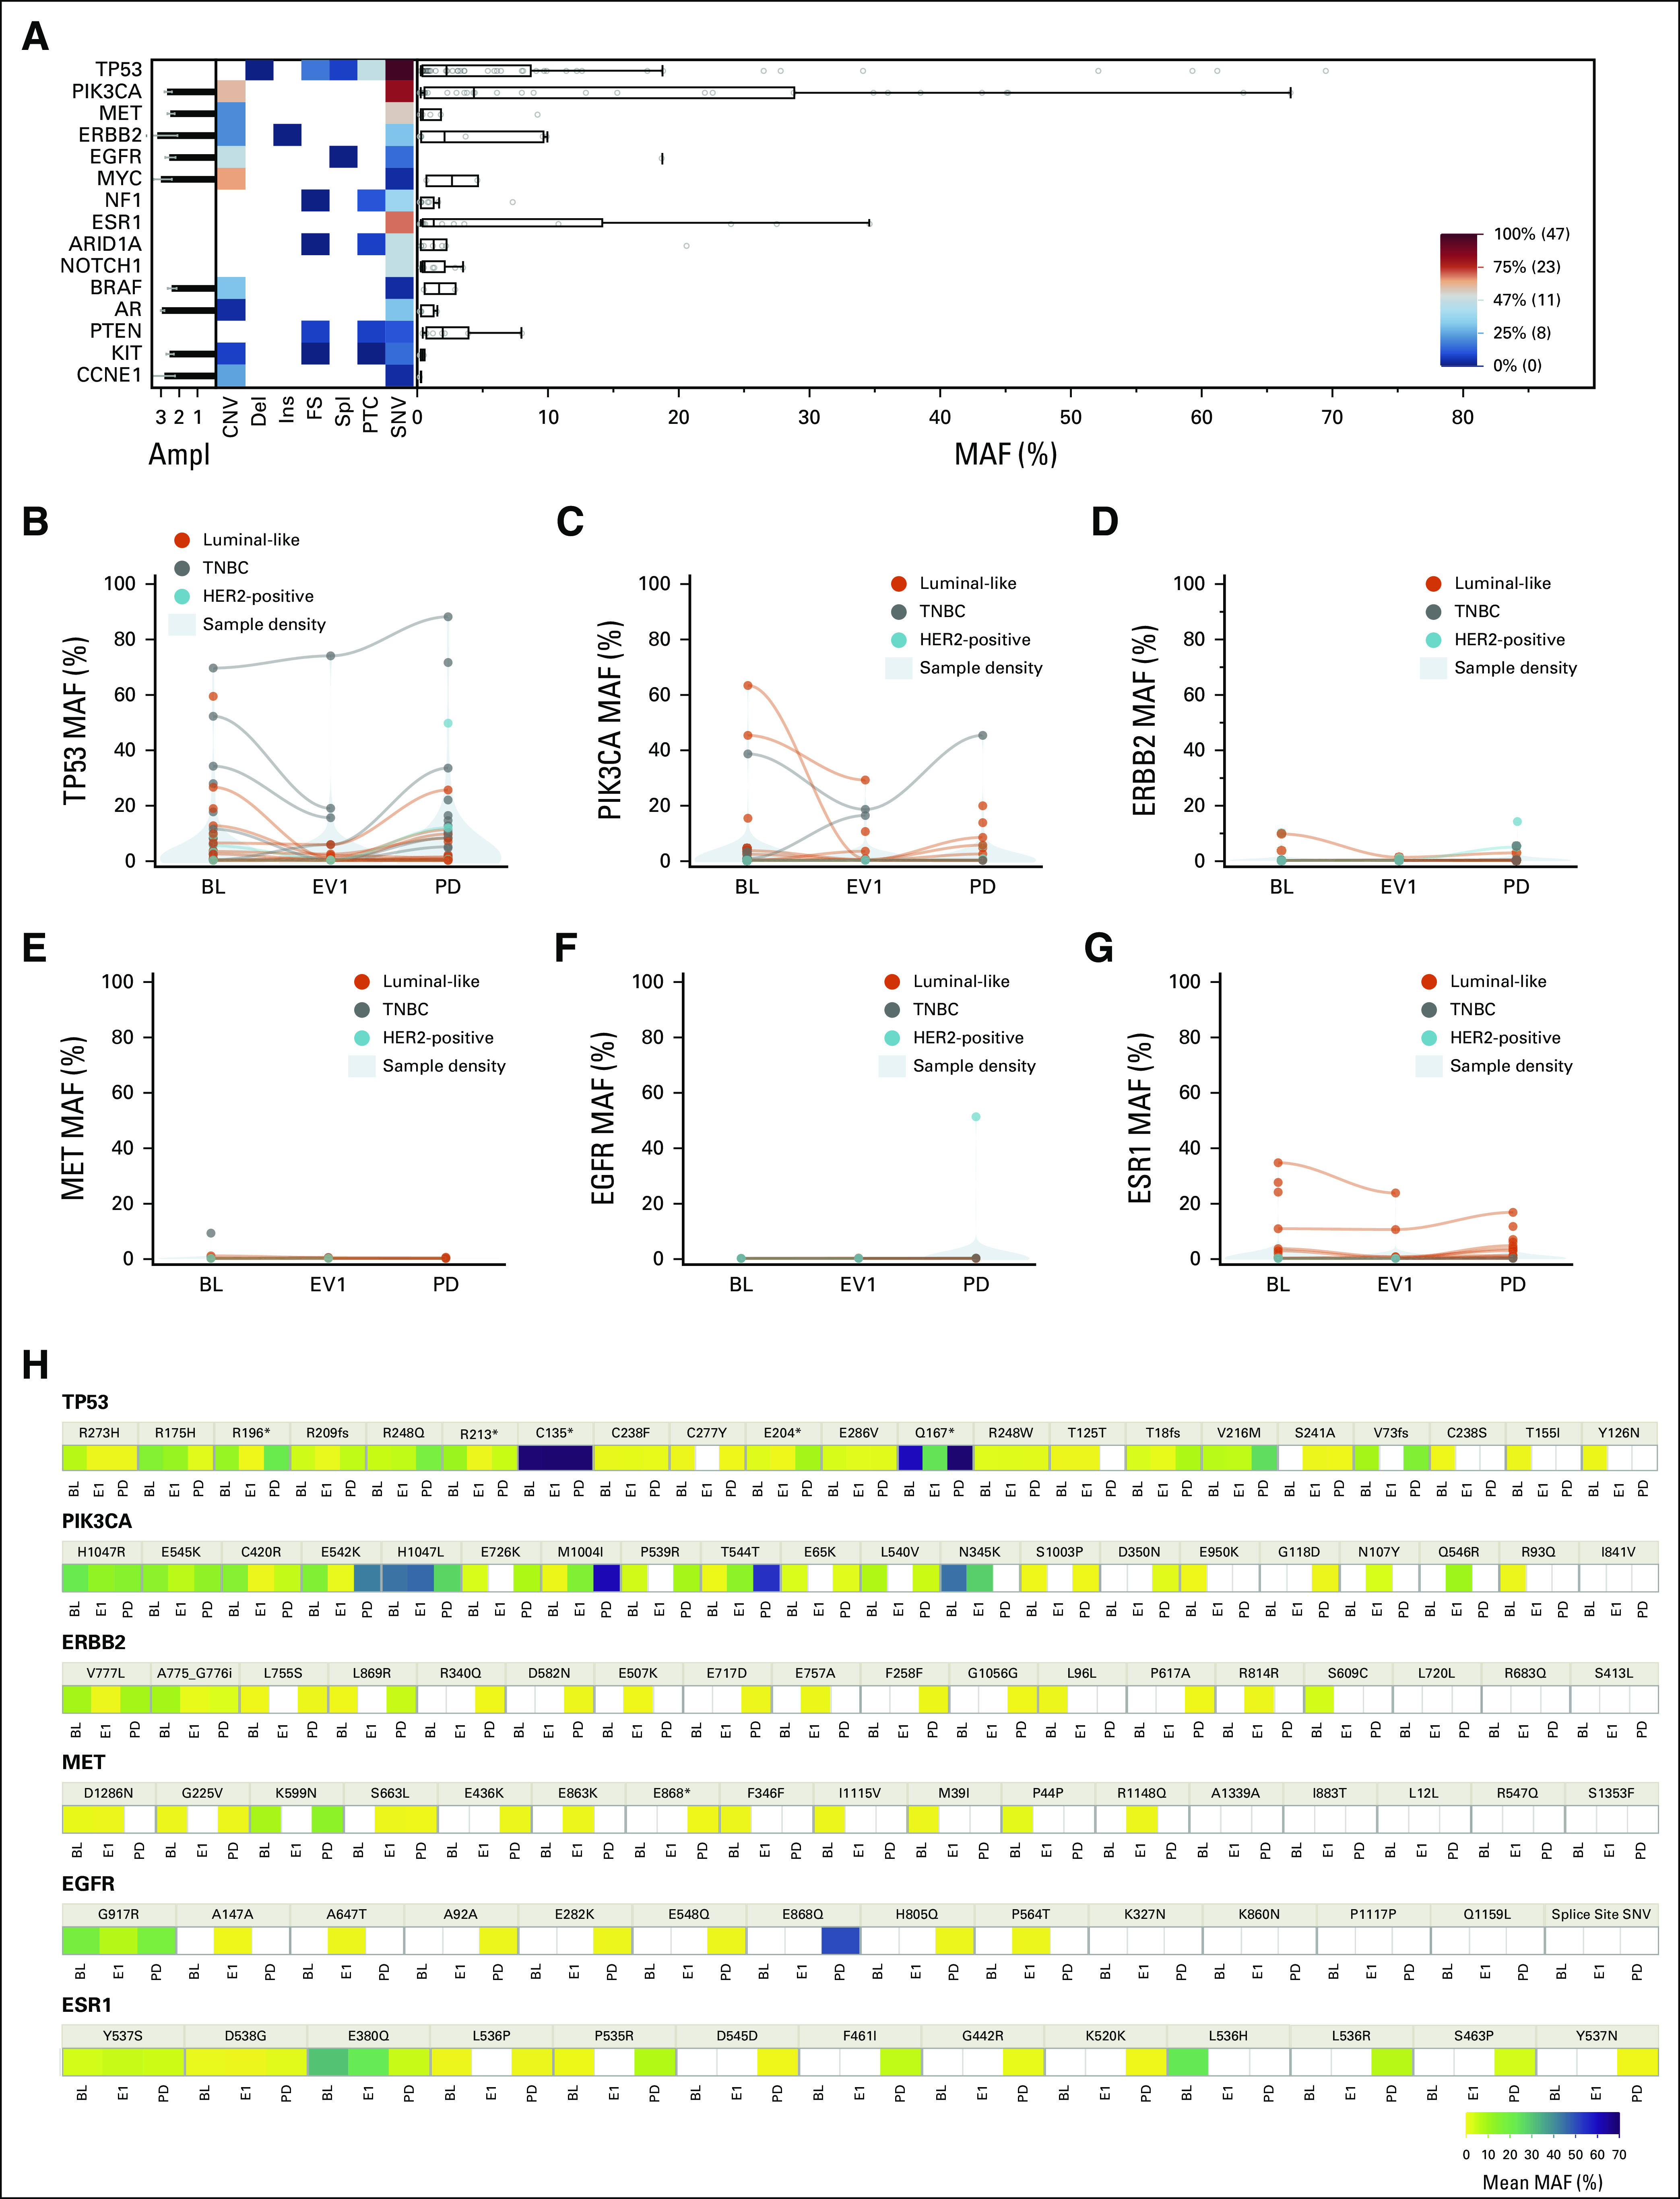
FIG 2.

(A) Landscape plot at BL, and (B-G) MAF variations of the top six mutated genes across timepoints as a whole and (H) broken down at variant level. Detected genomic alterations at BL are detailed in the (A) landscape plot as a heat map by type of alteration, MAF, and Ampl (from 1+ to 3+). Variants are classified as CNV, del, ins, FS, spl, PTC, and SNV. Boxplots (right) show the median and interquartile range for MAF, whereas the histograms (left) show the mean Ampl with standard deviation. Shown in the bottom right is a scale for the heat map; variants under the median prevalence are marked as blue, and above the median are depicted in red. (A) TP53 and PIK3CA aberrations were the most represented and (B, C, and H) their MAF varied across all timepoints consistently with the overall MAF. (D, G, and H) An increase in ERBB2 and ESR1 MAF was significant at progression especially in the luminal-like subtype (orange). Ampl, amplification; BL, baseline; CNV, copy-number variants; del, deletion; EV1, evaluation one; FS, frameshift; HER2, human epidermal growth factor receptor 2; ins, insertion; MAF, mutant allele frequency; PD, progressive disease; PTC, premature termination codons; SNV, single nucleotide variants; spl, splicing variants; TNBC, triple-negative breast cancer.
