
FIG 3.
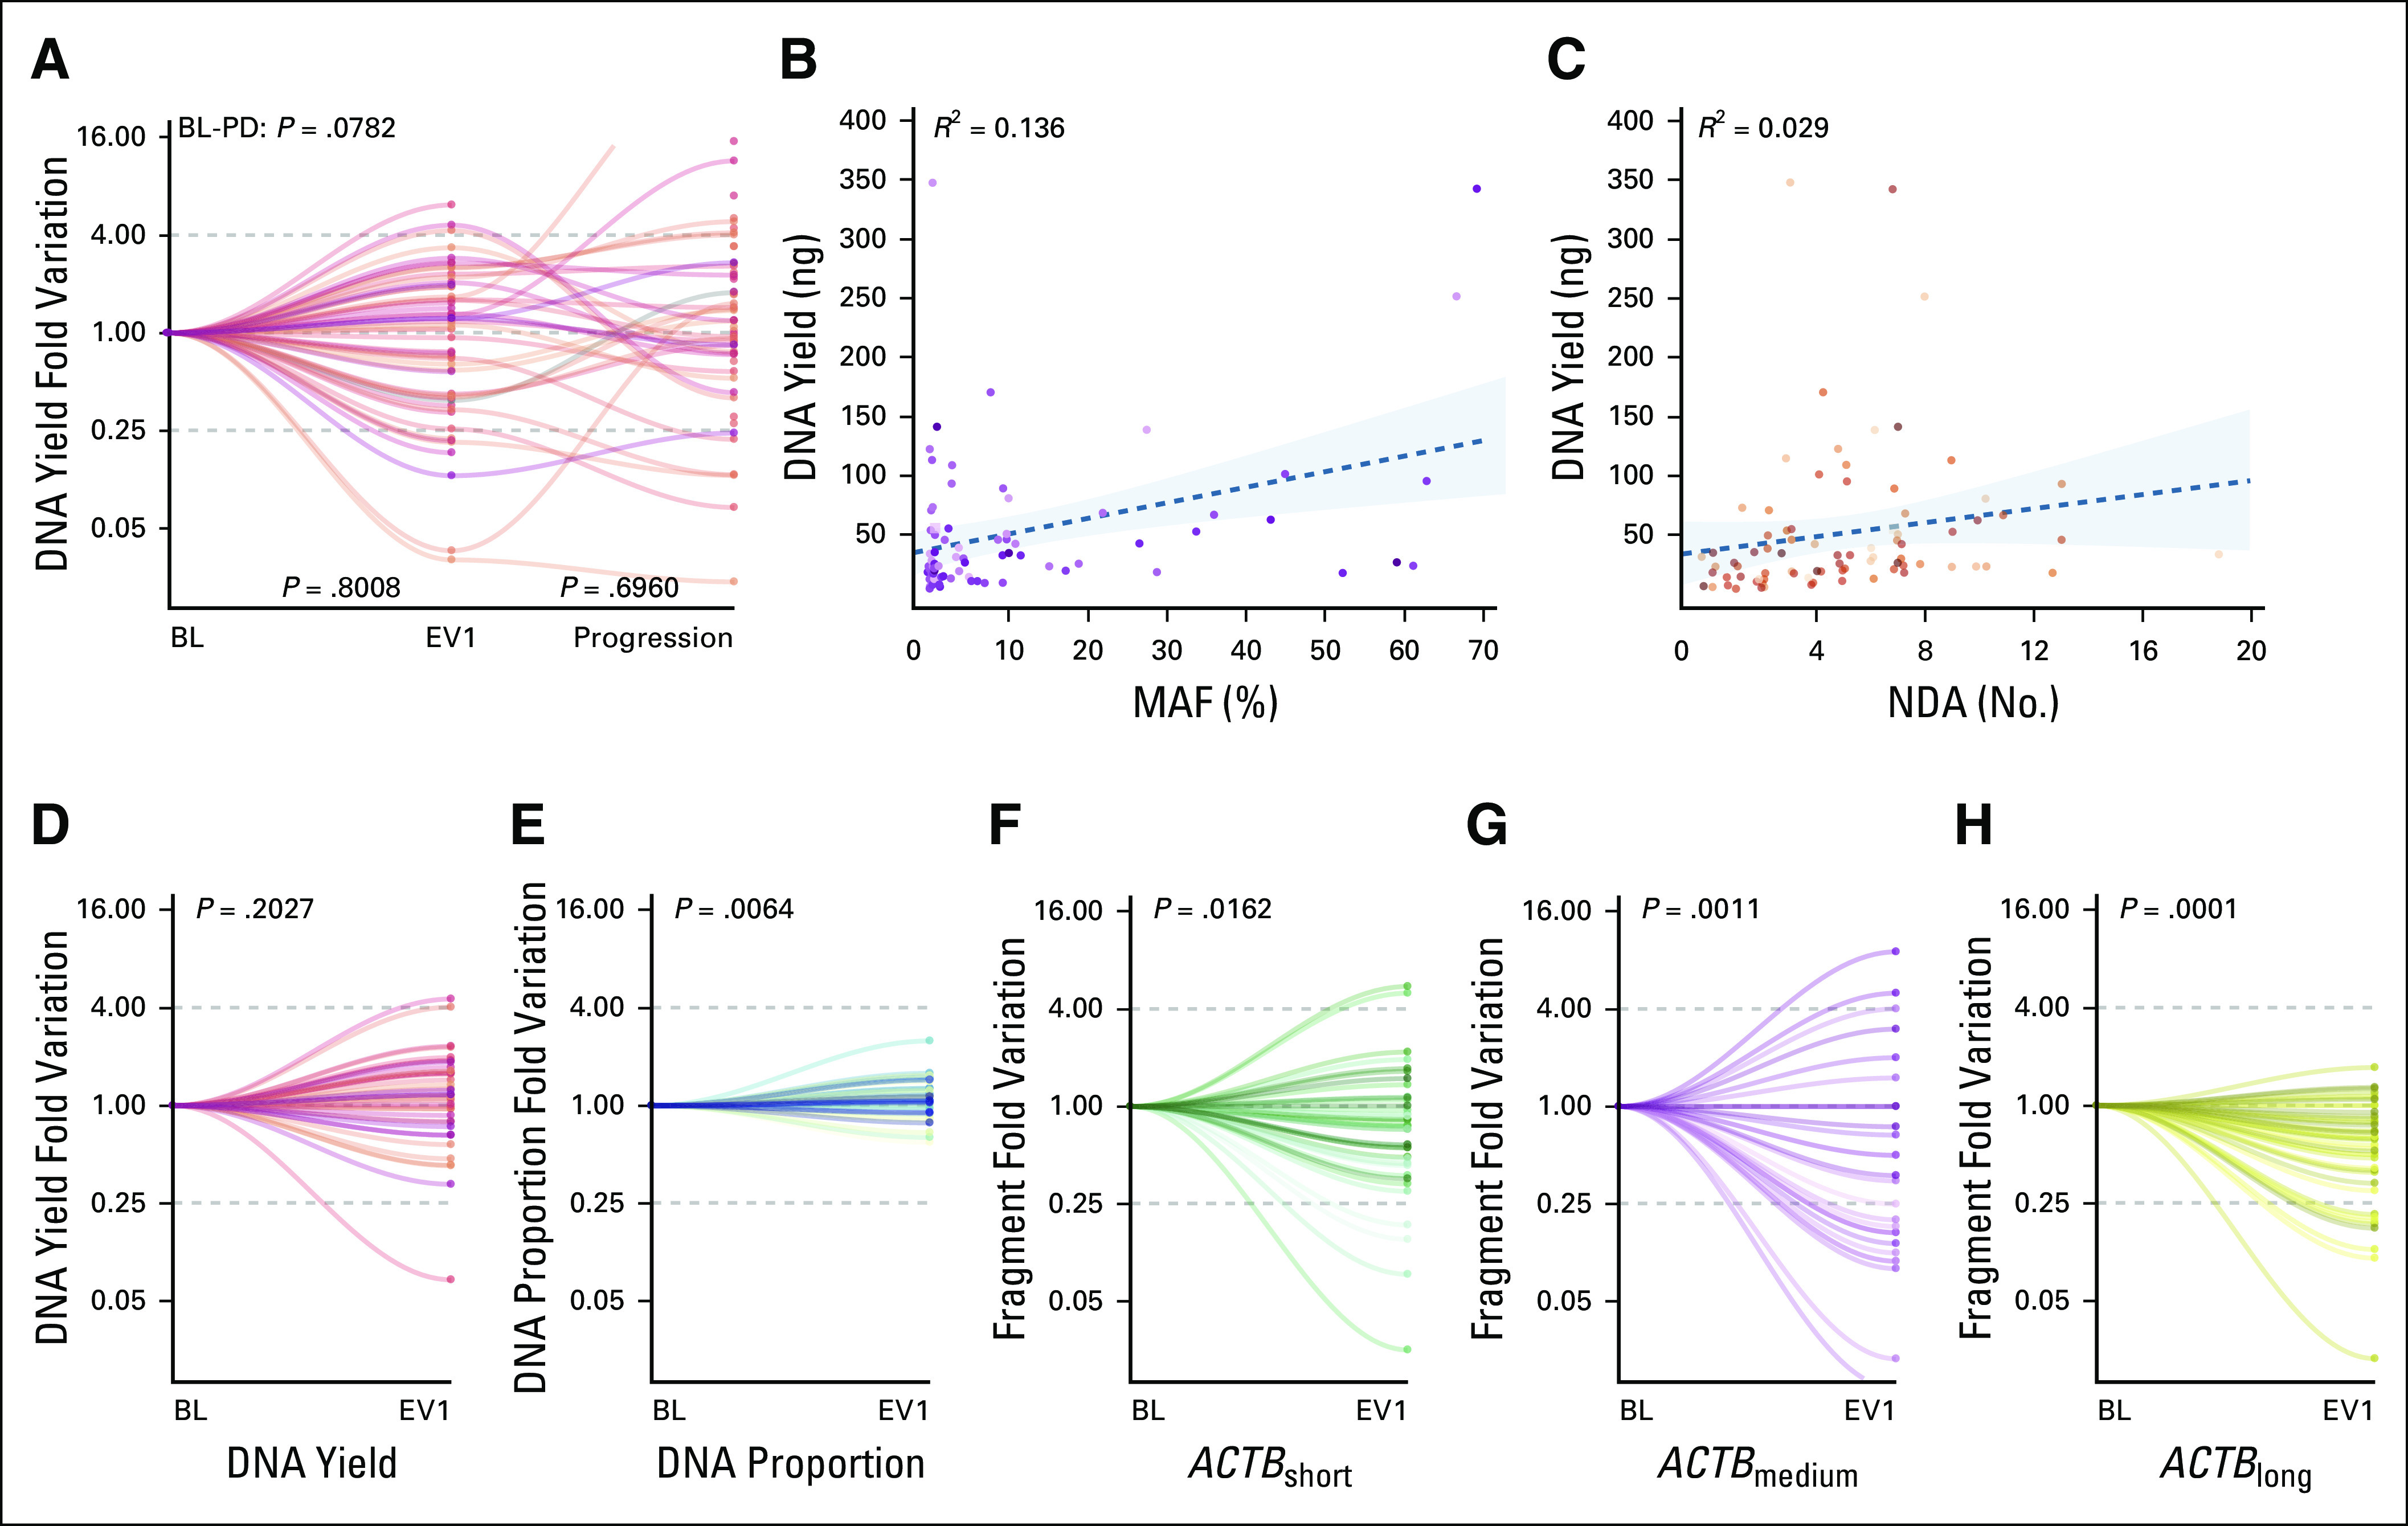
(A) DNA yield dynamics in the NU16B06 cohort. (B and C) Scatter plot of the correlation between MAF and NDA with DNA yield measured through the Qubit system. (D) DNA yield dynamics in the CRO-2018-56 cohort, (E) together with the early dynamics of the DNA proportion and (F, G, and H) different ACTB fragments. No significant differences were observed for (A) DNA yield in the NU16B06 cohort across study timepoints and (B) no correlation was observed between DNA yield and MAF or NDA at BL. (D) No significant variations were confirmed in the CRO-2018-56 prospective cohort for DNA yield, whereas (E) a significant increase in DNA proportion was observed between BL and EV1. A consistent decrease was observed for (F) ACTBshort, (G) ACTBmedium, and (H) ACTBlong. BL, baseline; EV1, evaluation one; MAF, mutant allele frequency, NDA, number of detected alteration; PD, progressive disease.