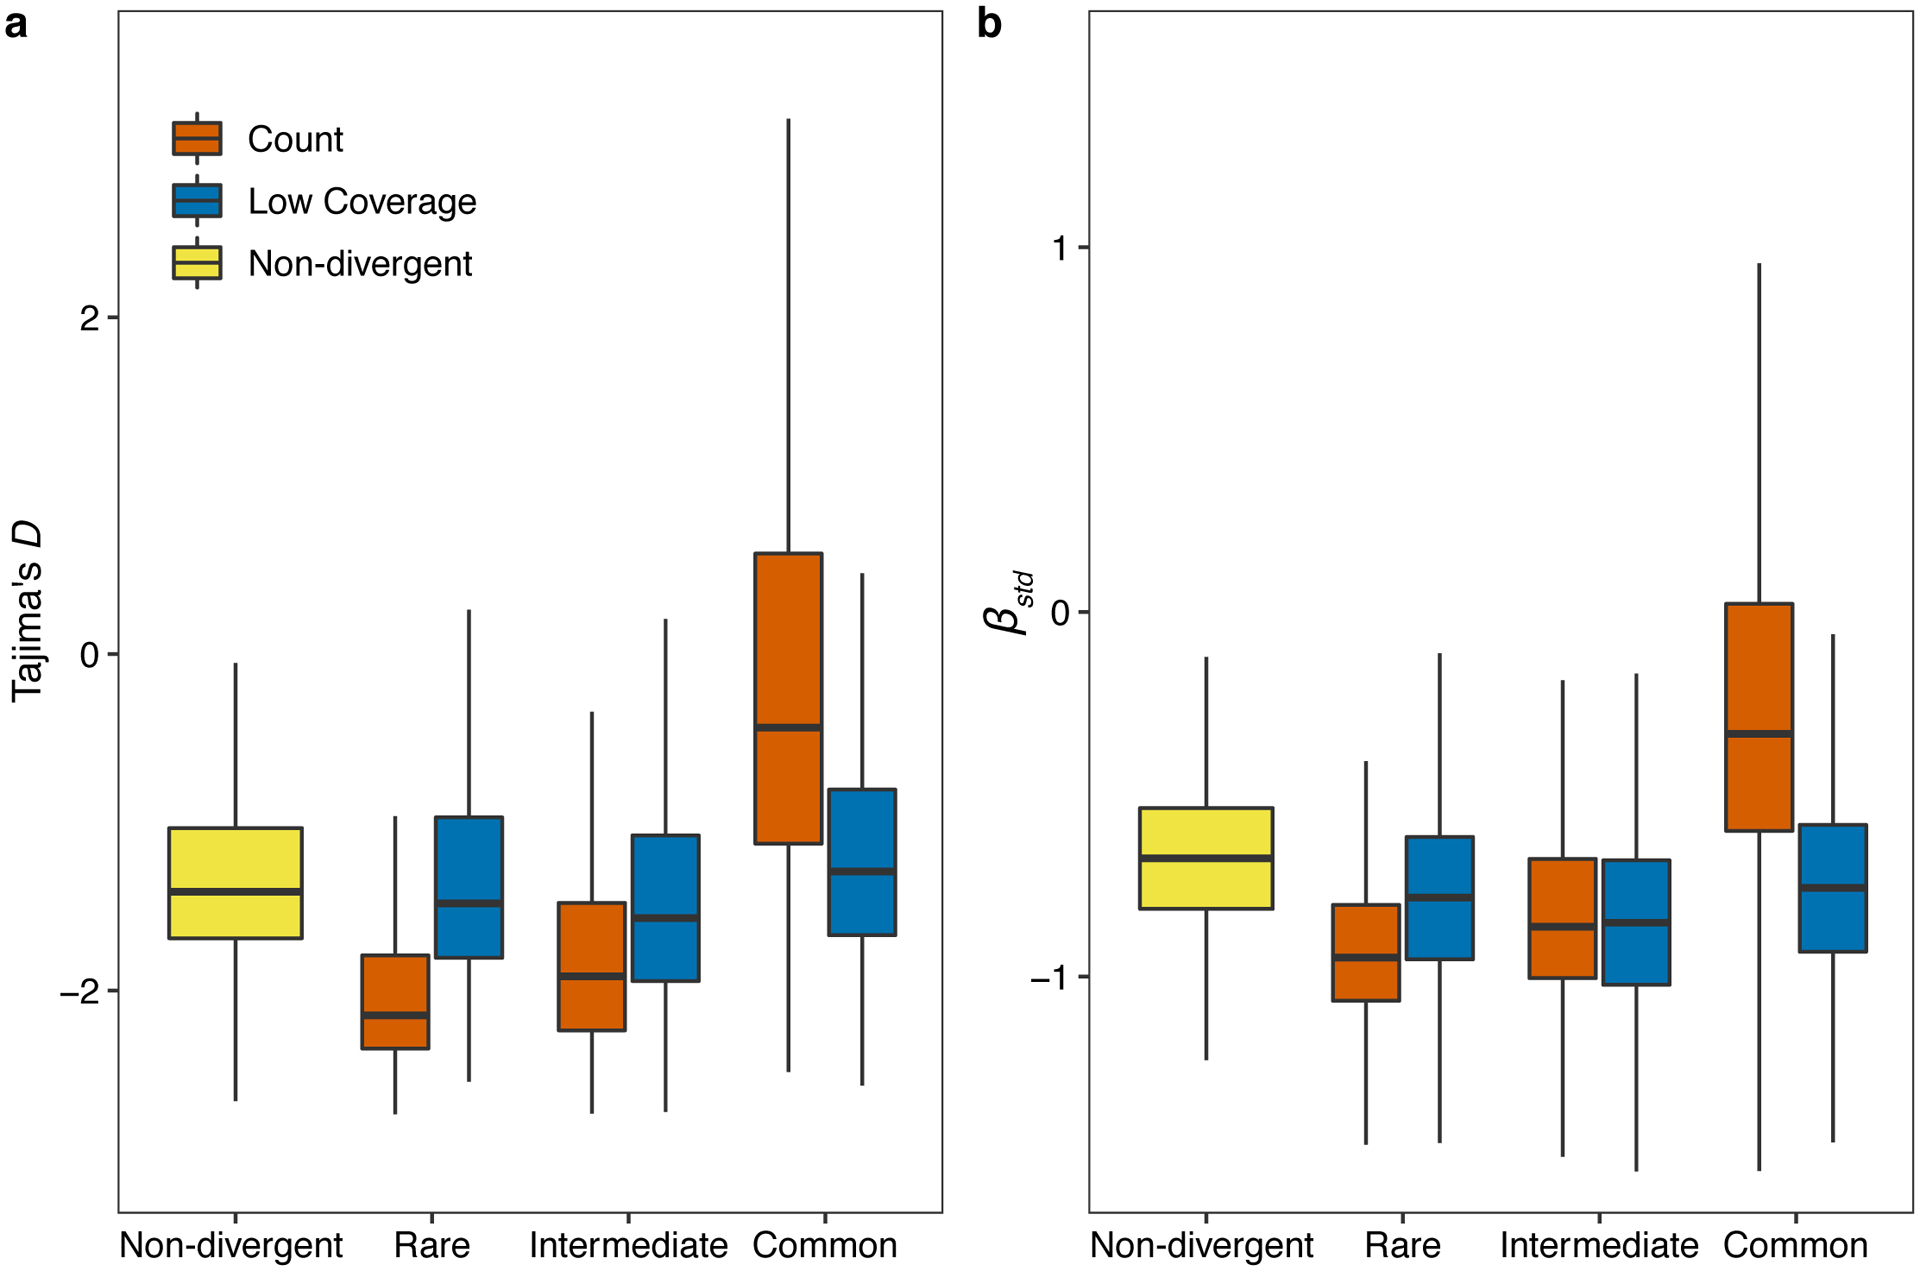
Extended Data Fig. 5. Genomic signatures of balancing selection in non-divergent regions and hyper-divergent regions.

Tukey box plots of Tajima’s D (a) and standardized beta (b) are shown. Genomic bins (1kb) (a) or variants (b) are grouped and colored by their classification: (1) non-divergent bins (yellow), (2) hyper-divergent bins with high variant density (> 16 SNVs/indels, red), (3) hyper-divergent bins with low read depth (< 35%, blue). Hyper-divergent bins are grouped by their species-wide frequencies: rare (<1%), intermediate (≥ 1% and < 5%), or common (≥ 5%). The horizontal line in the middle of the box is the median, and the box denotes the 25th to 75th quantiles of the data. The vertical line represents the 1.5x interquartile range.
