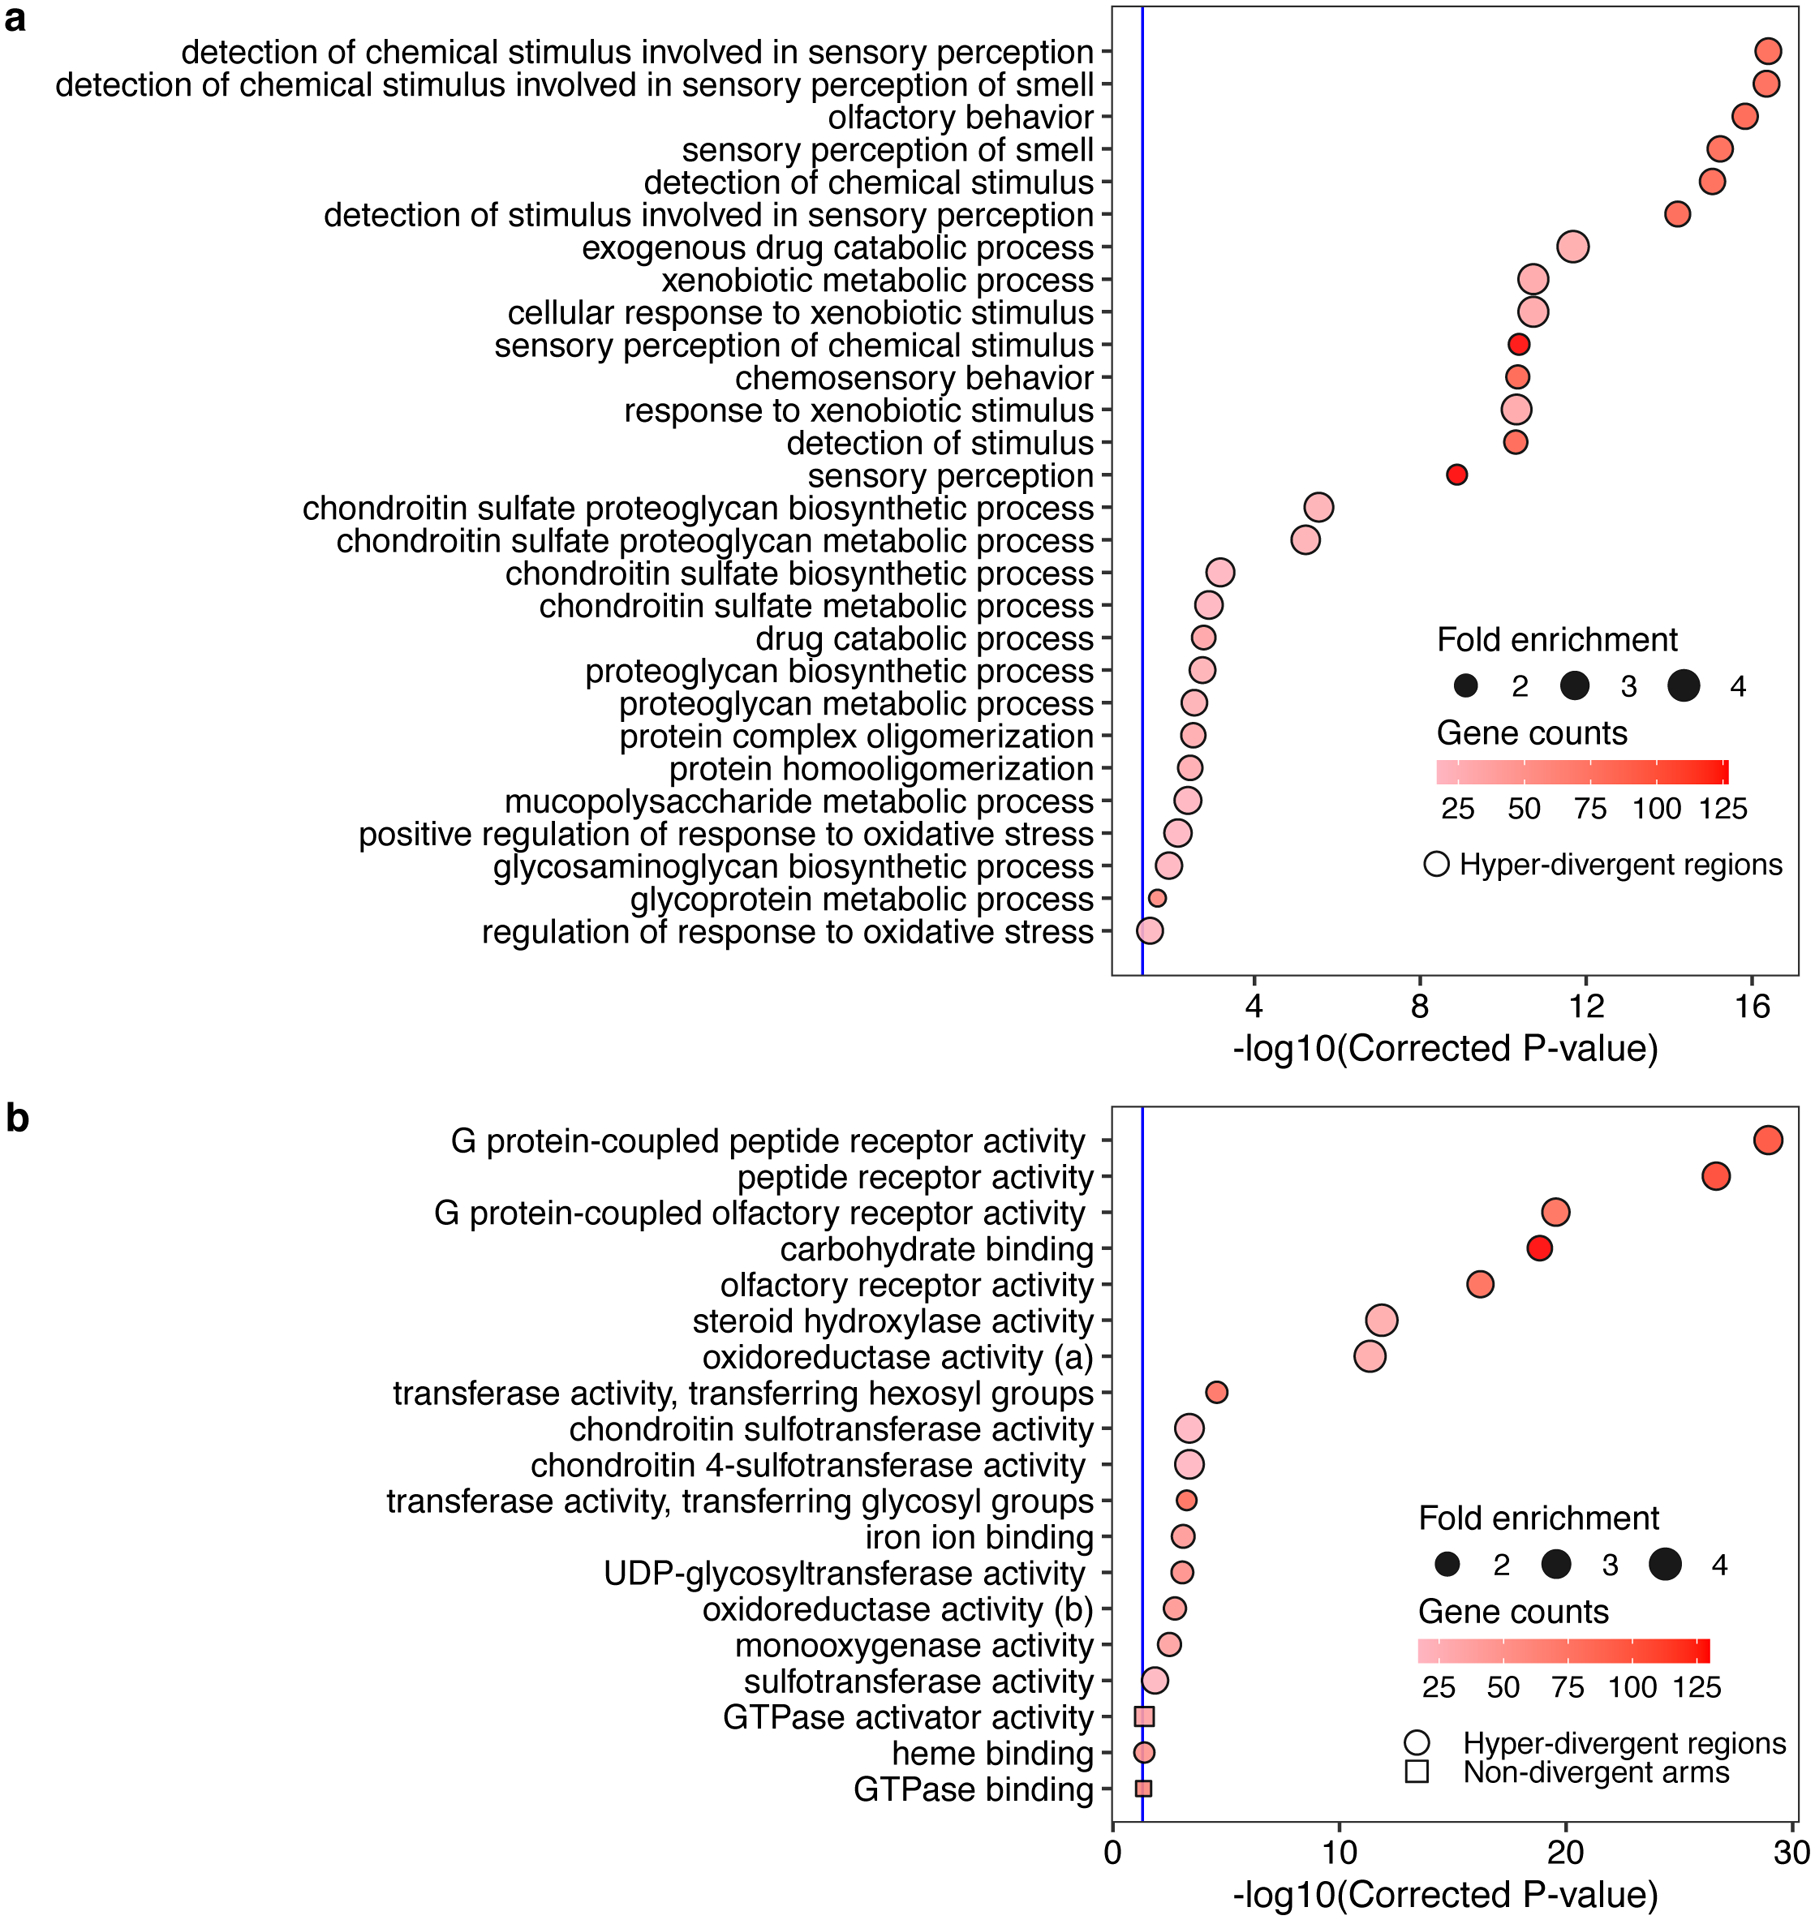
Extended Data Fig. 6. Gene ontology (GO) enrichment for hyper-divergent regions.

Gene ontology (GO) enrichment for the biological process category (a) and the molecular function category (b) for non-divergent chromosomal arms (square) and hyper-divergent regions (circle) are shown. Significantly enriched GO terms in control regions or hyper-divergent regions or both are shown on the y-axis. Bonferroni-corrected significance values for GO enrichment are shown on the x-axis. Sizes of squares and circles correspond to the fold enrichment of the annotation, and colors of square and circle correspond to the gene counts of the annotation. The blue line shows the Bonferroni-corrected significance threshold (corrected p-value = 0.05). Note, we did not detect any GO-term enrichment of genes in non-divergent chromosomal arms for the biological process category.
