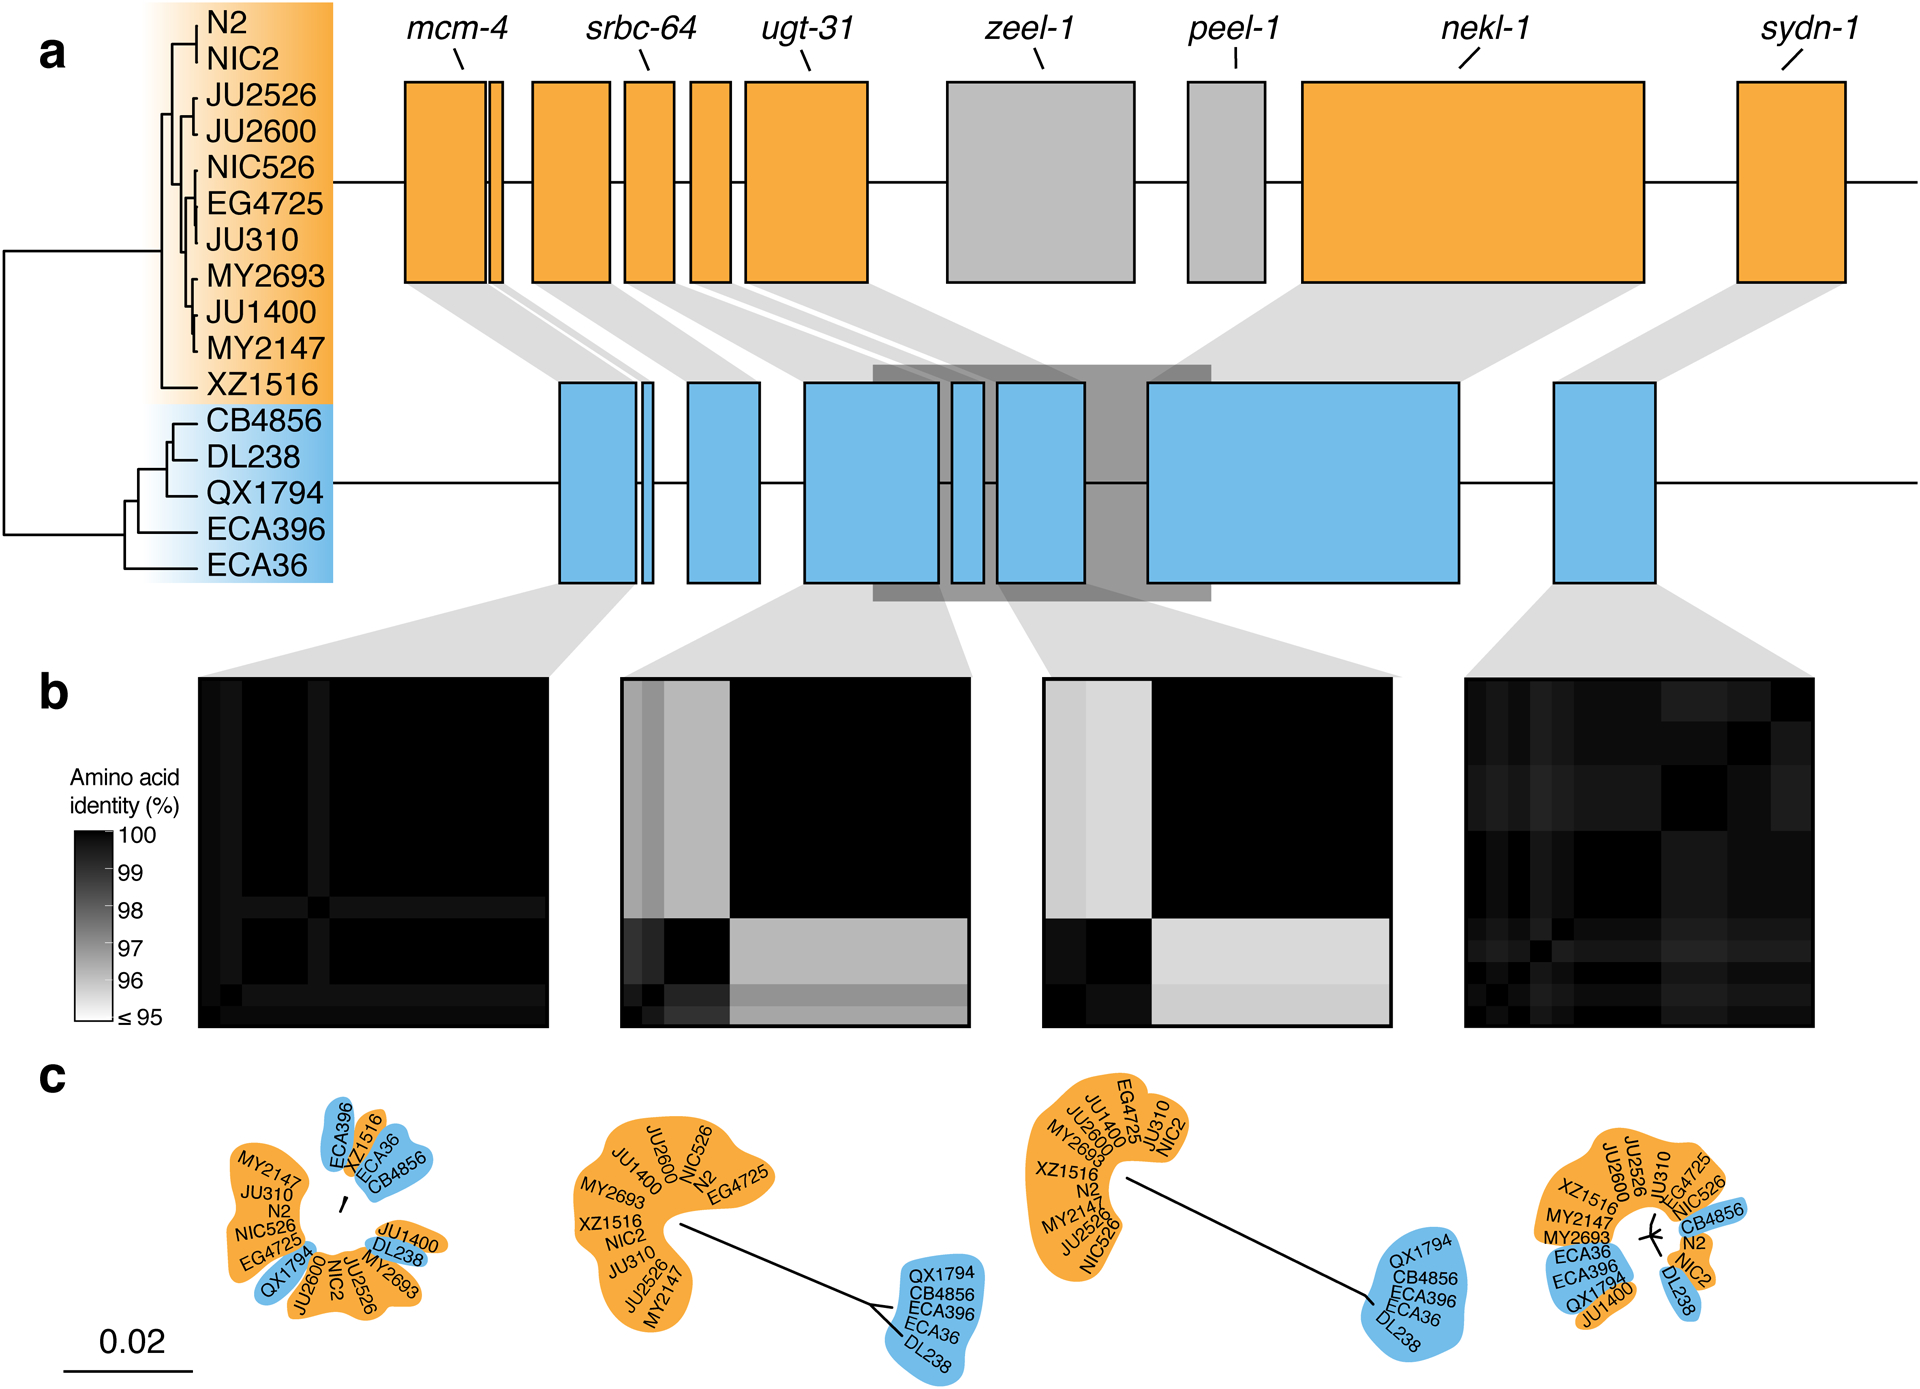
Extended Data Fig. 8. Two hyper-divergent haplotypes at the peel-1 zeel-1 incompatibility locus.

(a) The protein-coding gene contents of the two hyper-divergent haplotypes at the peel-1 zeel-1 incompatibility locus on the left arm of chromosome I (I:2,318,291–2,381,851 of the N2 reference genome). The tree was inferred using SNVs and colored by inferred haplotypes. For each distinct haplotype, we chose a single isotype as a haplotype representative (orange haplotype: N2, blue haplotype: CB4856) and predicted protein-coding genes using both protein-based alignments and ab initio approaches. Protein-coding genes are shown as boxes; those genes that are conserved in all haplotypes are colored based on their haplotype, and those genes that are not are colored light gray. Dark gray boxes behind genes indicate coordinates of divergent regions. Genes with locus names in N2 are highlighted.
(b) Heatmaps showing amino acid identity for alleles of four genes (mcm-4, srbc-64, ugt-31, and sydn-1). The percentage identity was calculated using alignments of protein sequences from all 16 isotypes. Heatmaps are ordered by the SNV tree shown in (a).
(c) Maximum-likelihood gene trees of four genes (mcm-4, srbc-64, ugt-31, and sydn-1) inferred using amino acid alignments. Trees are plotted on the same scale (scale shown; scale is in substitutions per site). Strain names are colored by their haplotype.
