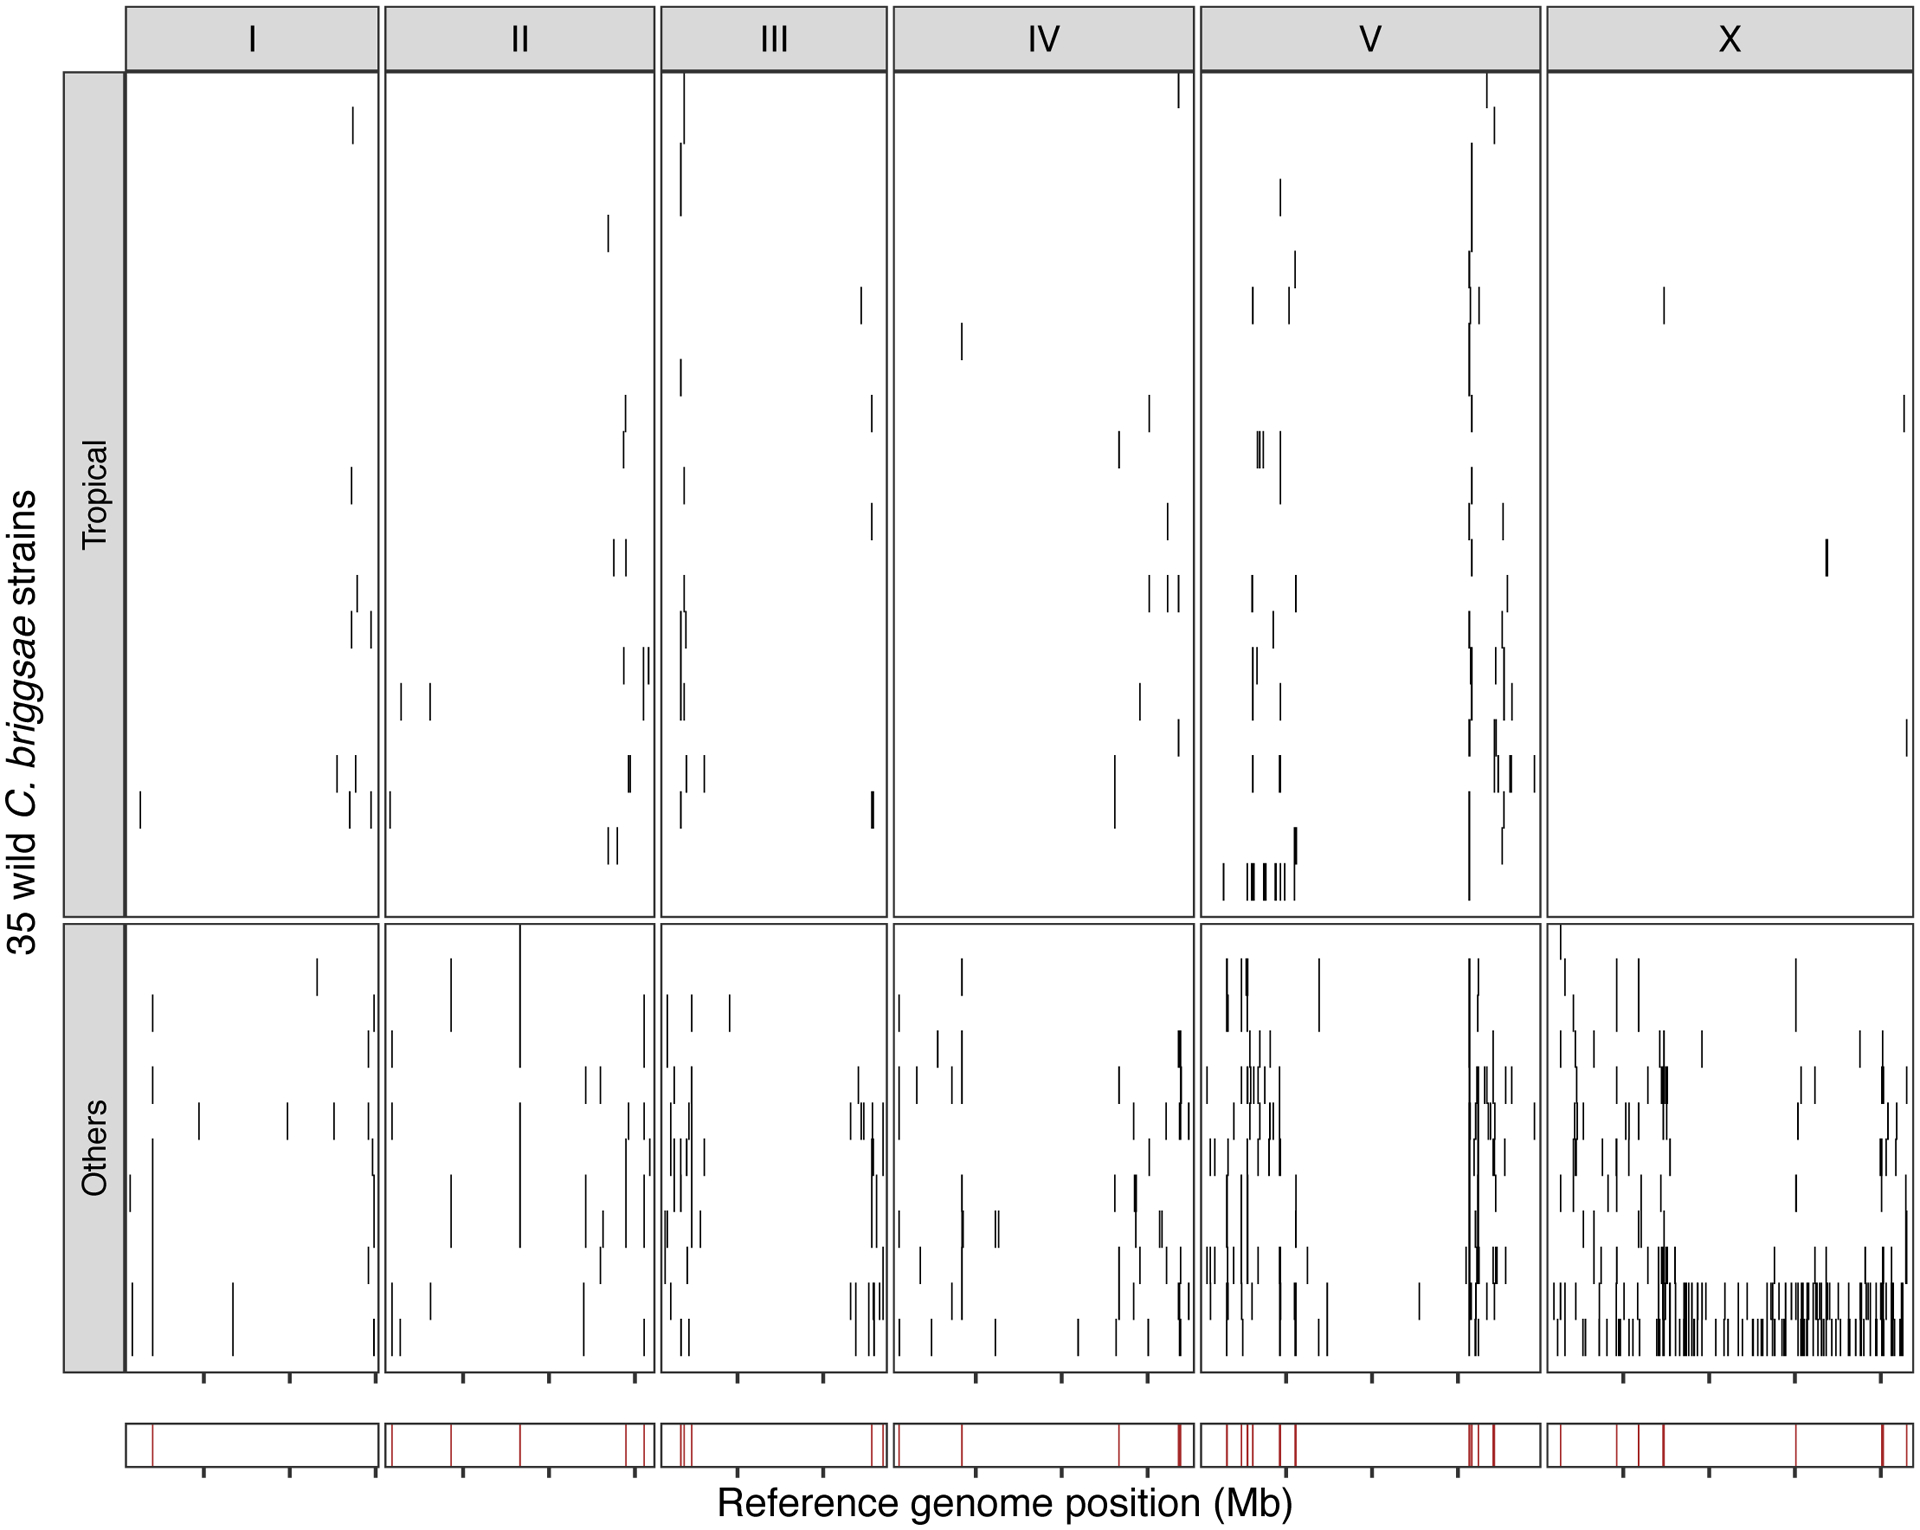
Extended Data Fig. 10. Hyper-divergent regions in C. briggsae.

The genome-wide distribution of hyper-divergent regions across 35 non-reference wild C. briggsae strains is shown. In the top panel, each row is one of the 35 strains, grouped by previously defined clades (tropical or others) ordered by the total amount of genome covered by hyper-divergent regions (black). In the bottom panel, brown bars indicate genomic positions in which more than 10% of strains are classified as hyper-divergent at the locus. The genomic position in Mb is plotted on the x-axis, and each tick represents 5 Mb of the chromosome.
