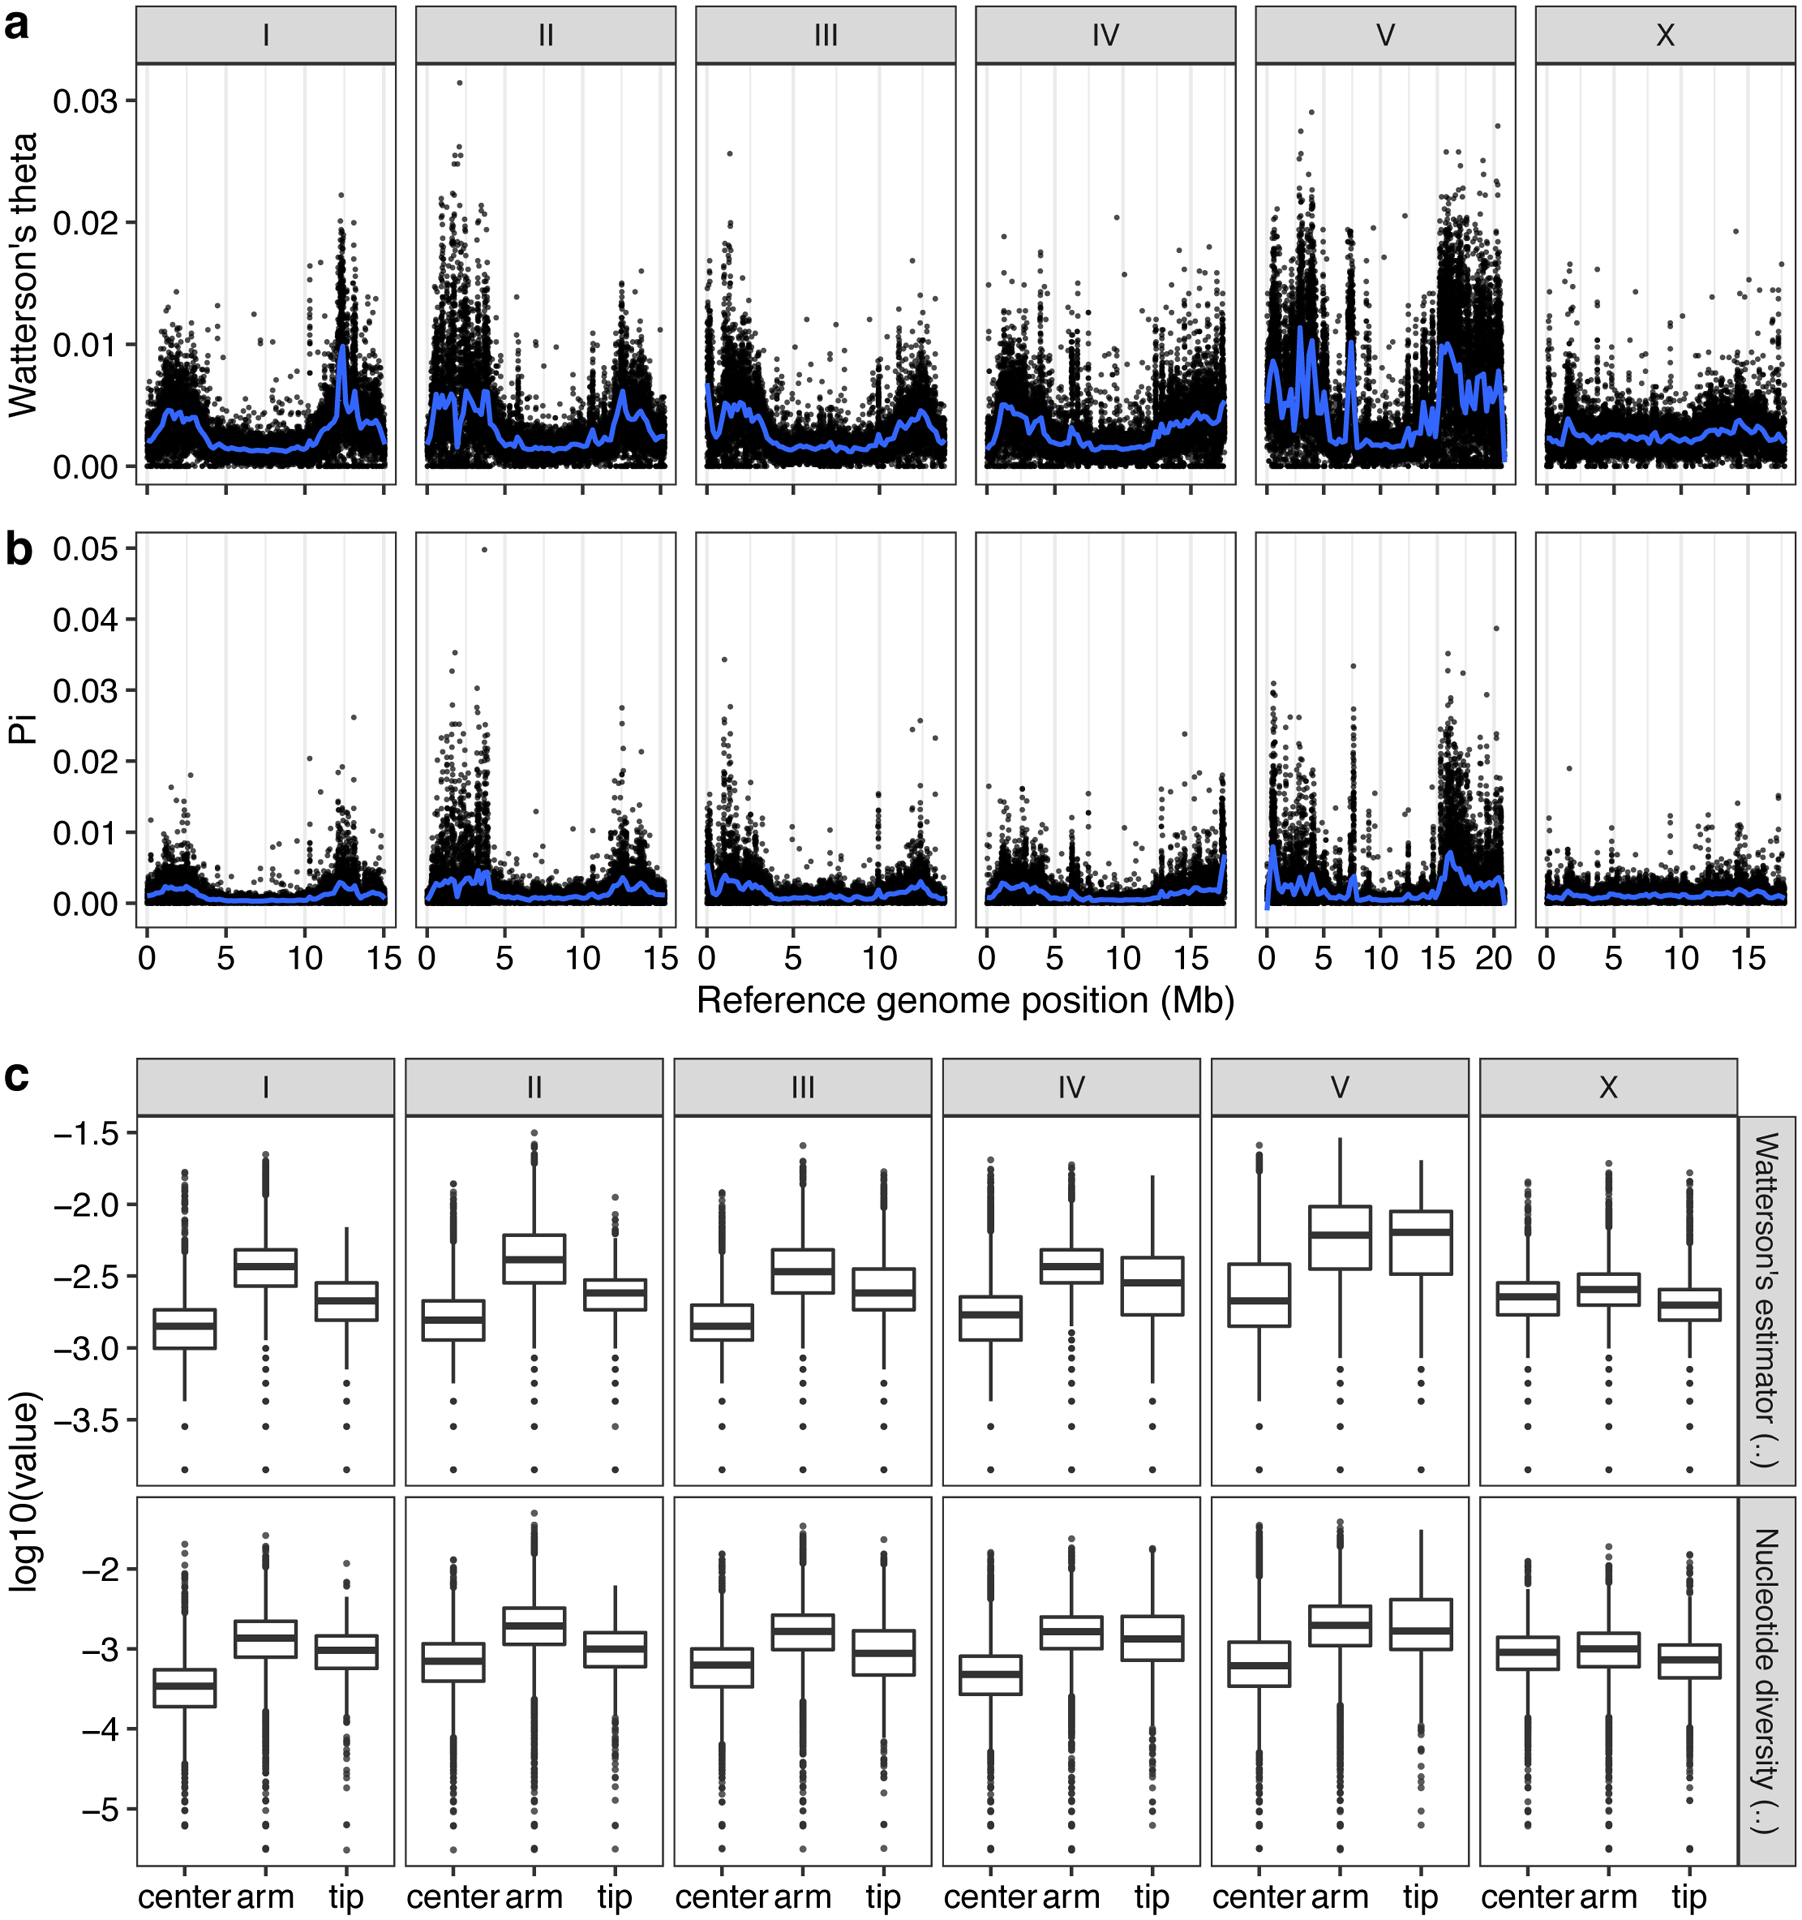
Extended Data Fig. 2. Patterns of molecular diversity across the C. elegans genome.

The chromosomal patterns (a) Watterson’s theta (θ) and (b) nucleotide diversity (pi) for non-overlapping 1 kb windows are shown. Each dot corresponds to the calculated value for a particular window. The genomic position in Mb is plotted on the x-axis. Diversity statistic values are shown on the y-axis. Smoothed lines (blue) are LOESS fits. (c) Tukey box plots of genetic diversity statistics from (a) are shown with outlier data points plotted. Genetic diversity statistics for each sliding window are grouped by the chromosomal region defined previously (Rockman and Kruglyak, 2009). Genetic diversity statistic values are shown on the y-axis. The horizontal line in the middle of the box is the median, and the box denotes the 25th to 75th quantiles of the data. The vertical line represents the 1.5x interquartile range.
