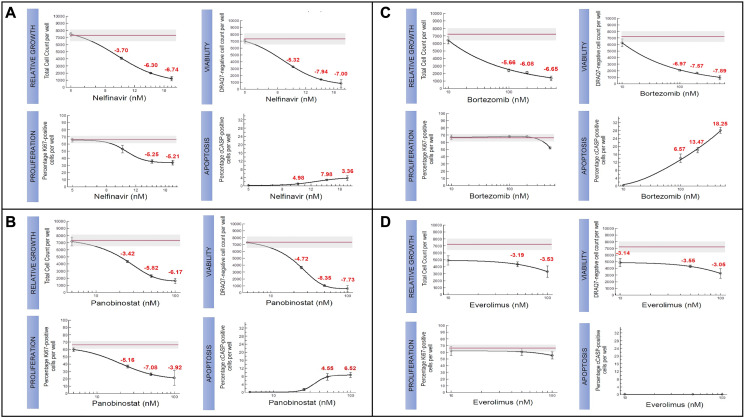
Figure 3. Candidate therapeutics tested for TH4 subtype in IU-TAB-1 cell line.
Experimental dose-response curves assessing relative growth (Hoechst staining of DNA), proliferation (Ki67), viability (DRAQ7 assay), and apoptosis (caspase) for (A) Nelfinavir, (B) Panobinostat, (C) Bortezomib, and (D) Everolimus. The red line in the experimental graphs indicate DMSO treated control.

