FIGURE 3.
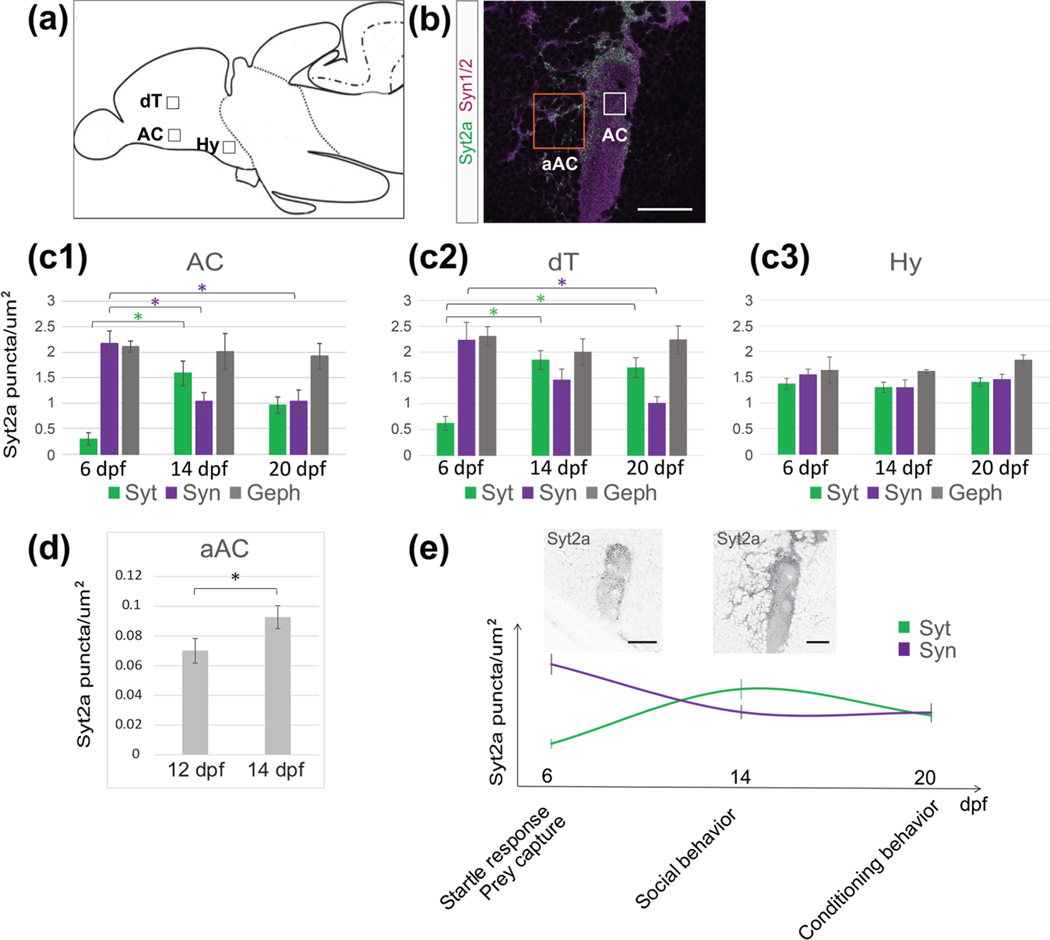
Syt2a expression levels in the telencephalon change over time. (a) Cartoon showing a sagittal view of a zebrafish brain. Boxes mark the selected region of interest (ROI) used for synapse counts. (b) Image showing the anterior commissure (AC) labeled for Syt2 (green) and Syn1/2 (magenta) at 14 dpf. The white box shows the actual size of ROI used for counting. The orange box shows an ROI for a synapse count on neuronal cell bodies located adjacent to the AC (aAC). (c1–c3) Changes in synapse density of Syt2, Syn1/2, and Geph puncta at 6, 14, and 20 dpf in the anterior commissure (AC, 3c1), dorsal telencephalon (dT, 3c2), and hypothalamus (Hy, 3c3). Significance was determined using a Tukey–Kramer HSD, with *p < .05. (d) The number of Syt2 puncta on neuronal cell bodies in the aAC (see (b), orange box) increases between 12 and 14 dpf. Significance was determined using a Student’s t test, with *p < .05. n = 6 brains for 12 dpf and 5 brains for 14 dpf. (e) Graph shows Syt2a and Syn1/2 puncta density in the AC (see (c1–c3)) over time while marking behavioral milestones during zebrafish larval development. The two images show representative Syt2a expression at 6 and 14 dpf, respectively, demonstrating the increase in Syt2 puncta aAC. Scale bars are 30 μm in (b) and 10 μm in (e)

