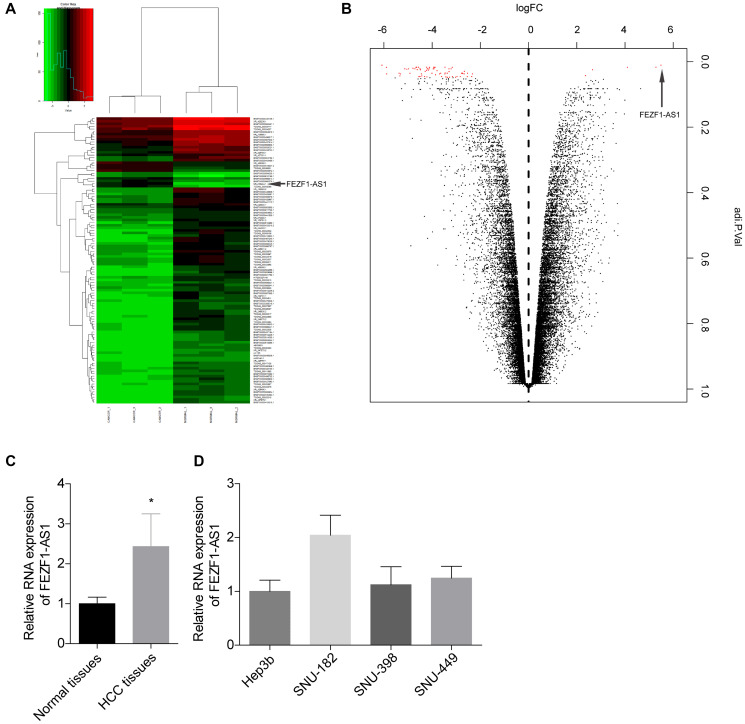
Figure 1.
FEZF1-AS1 level was elevated in HCC. (A) Heat map showing the differently expressed lncRNAs in the tumor tissues and adjacent normal tissues from HCC patients. Genes shown in red were upregulated and genes shown in green were downregulated lncRNAs. (B) Volcano plot of the differently expressed lncRNAs in the tumor tissues and adjacent normal tissues from HCC patients. Genes on the right were upregulated and genes on the downregulated lncRNAs. (C) The relative expression level of FEZF1-AS1 in tumor tissues and the adjacent normal tissues was detected by qRT-PCR, *P < 0.05. (D) The relative expression levels of FEZF1-AS1 in HCC cell lines were tested by qRT PCR, *P < 0.05.

