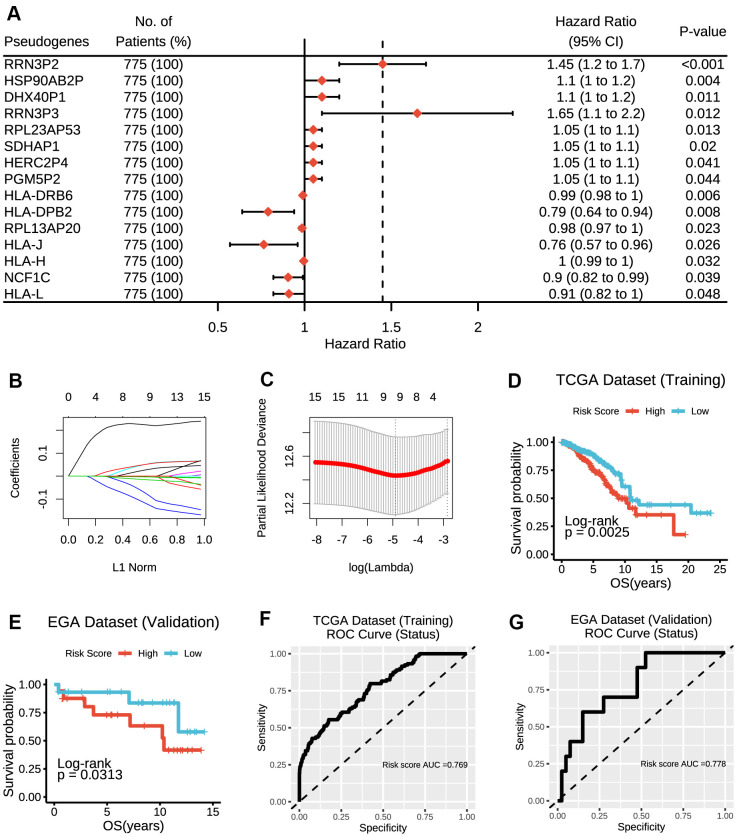
Figure 1.
Construction of the risk score model based on prognostic pseudogenes. (A) The hazard ratios (HR), 95% confidence intervals (CI) calculated by univariate Cox proportional hazard regression of 15 prognostic pseudogenes using TCGA data. (B) LASSO coefficient profiles of 15 prognostic pseudogenes. (C) Ten-time cross-validation for tuning parameter selection in the LASSO model of 15 prognostic pseudogenes. (D) The breast cancer patients from TCGA dataset in high-risk group displayed significantly shorter overall survival than those in low-risk group (p = 0.0025). (E) The breast cancer patients from EGA dataset in high-risk group displayed significantly shorter overall survival than those in low-risk group (p = 0.0313). (F) The ROC curve and AUC for the risk score model in TCGA dataset. (G) The ROC curve and AUC for the risk score model in EGA dataset.

