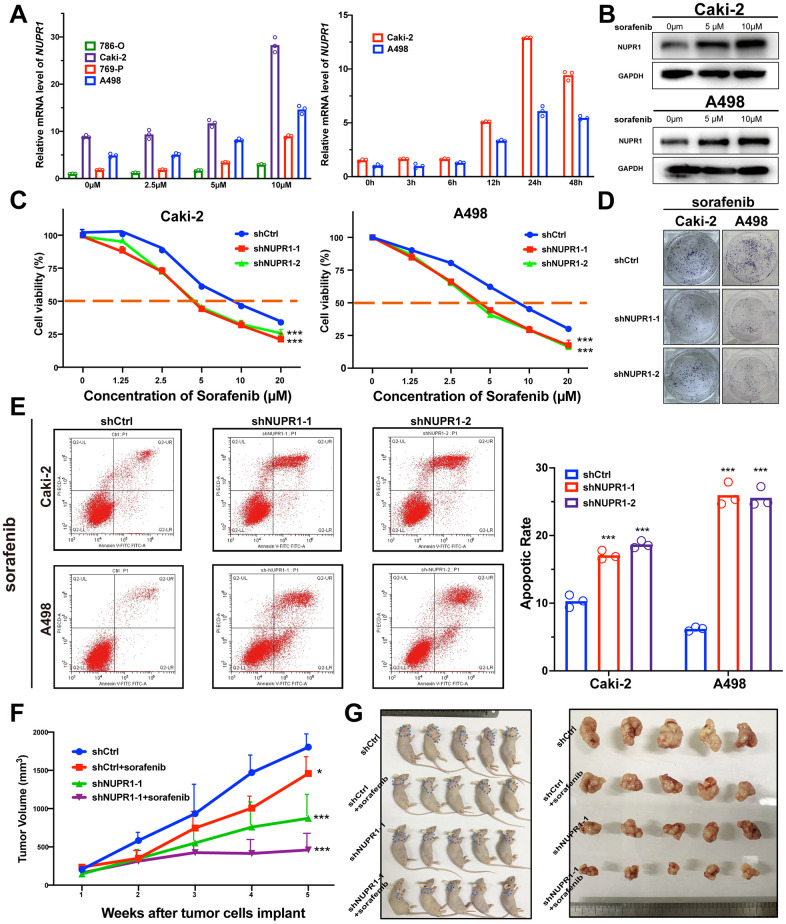
Figure 4.
Depletion of NUPR1 promoted sensitivity to sorafenib in ccRCC. (A) Time and concentration-dependent manner of sorafenib treatment on NUPR1 expression in ccRCC cell lines verified by qRT-PCR. (B) Western blot assay of sorafenib inducing NUPR1 protein expression. (C) CCK-8 assay of NUPR1 silencing after sorafenib treatment at the indicated concentrations for 24h. The IC50 values were 10.26, 5.28, 5.86 μM for shCtrl, shNUPR1-1, shNUPR1-2, respectively in Caki-2. The IC50 values were 8.73, 4.55, 4.36 μM, respectively in A498. (D) Colony formation experiments of NUPR1 silencing after sorafenib (5μM) treatment for 2 weeks. (E) Flow cytometry analysis of effects of NUPR1 depletion on apoptosis after sorafenib (5μM) treatment for 24h. (F) Growth curves of subcutaneous xenografts in nude mice (n=5) under different treatments. (G) Images of nude mice and anatomical picture of subcutaneous xenografts. (*p < 0.05, **p < 0.01, ***p < 0.001). CCK-8: cell counting kit-8; ccRCC: clear cell renal cell carcinoma; IC50: 50% inhibiting concentration; qRT-PCR: quantitative real-time reverse transcription PCR.

