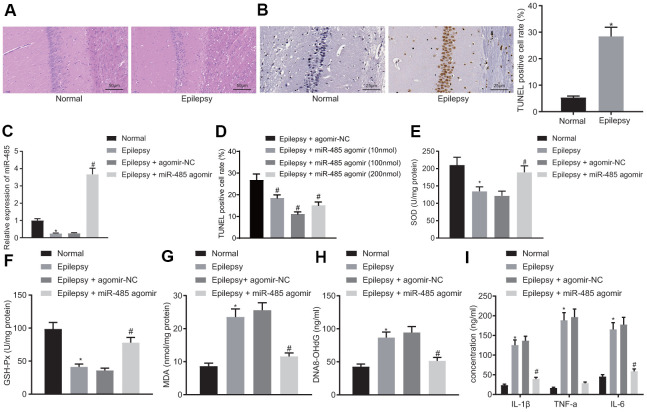
Figure 1.
miR-485 overexpression attenuates epilepsy. (A) Representative HE micrographs showing histopathological changes in the hippocampus (200 ×). (B) Cell apoptosis in the hippocampus determined by TUNEL assay (400 ×). (C) miR-485 expression in mouse brain tissues determined by RT-qPCR. (D) Cell apoptosis in the hippocampus determined by TUNEL assay (400 ×). (E) SOD levels. (F) GSH-Px levels. (G). MDA levels. (H) DNA 8-OHdG levels. (I) IL-1β, TNF-α, IL-6 levels. * p < 0.05 vs. control mice; # p < 0.05 vs. epileptic mice treated with agomir-NC; n = 10. Data were expressed as mean ± standard deviation. Data between two groups were compared independent sample t-test. Data among multiple groups were compared by one-way analysis of variance and post-hoc Tukey’s test.

