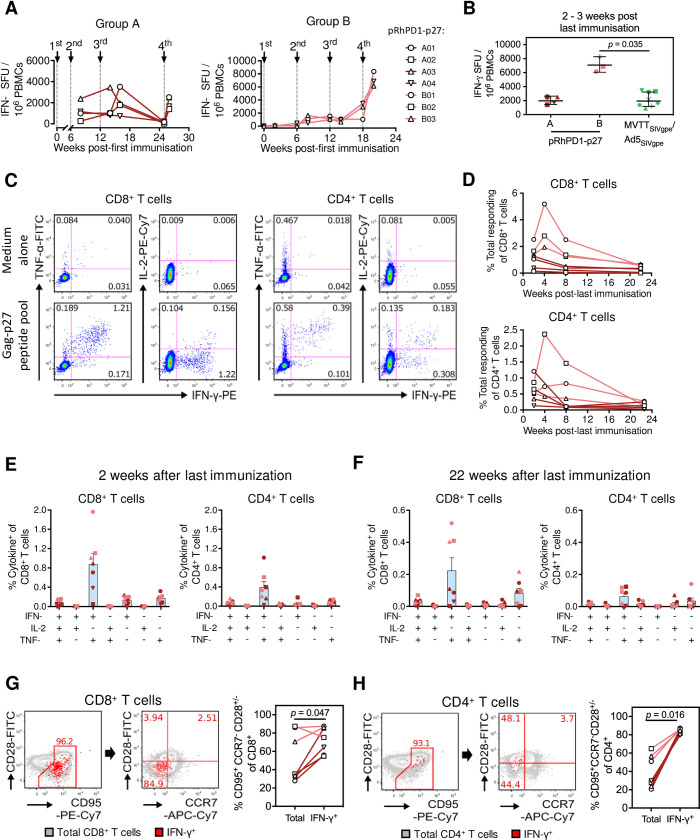
Fig 3. T cell immunogenicity of the pRhPD1-p27 vaccine in rhesus macaques.
(A) Kinetics of p27-specific cellular immune responses in peripheral blood measured by IFN-γ ELISpot. (B) Comparison of ELISpot-detected p27-specific T cell responses induced in Groups A and B by the pRhPD1-p27 vaccine with historical data of Gag-specific T cell responses induced by MVTTSIVgpe/AD5SIVgpe vaccination in Chinese-origin rhesus macaques 12. (C) Representative FACS plots demonstrating the production of IFN-γ, TNF-α and IL-2 by CD8+ (left) and CD4+ T cells (right) at 2 weeks post last immunization, as detected by ICS assays after ex vivo stimulation with the overlapping SIV Gag-p27 peptide pool. (D) Kinetics of p27-specific CD8+ (top) and CD4+ T cells (bottom) in PBMCs after last immunization, as detected by ICS assays. (E) Poly-functionality analysis of p27-specific CD8+ (left) and CD4+ T cell responses (right) at 2 weeks after last immunisation. (F) Poly-functionality analysis of CD8+ (left) and CD4+ T cell responses (right) during memory phase at 22 weeks after last immunisation. For (E) and (F), means ± SEM are shown. (G) Phenotypes of p27-specific CD8+ and (H) CD4+ T cells induced by pRhPD1-p27 vaccination in macaques. PBMC isolated at 8 weeks post last immunisation were stimulated with the overlapping Gag-p27 peptide pool, followed by surface and ICS analysis. Representative FACS plots (left) show the expression of CD95, CD28, and CCR7 on the overall T cell populations (grey) and IFN-γ-producing T cells (red). Frequencies of TEM (CD95+ CD28+or—CCR7-) were compared between the overall and IFN-γ-producing T cells (right). Statistical significance was determined by the Wilcoxon matched-pairs signed rank test.

