
Figure 2.
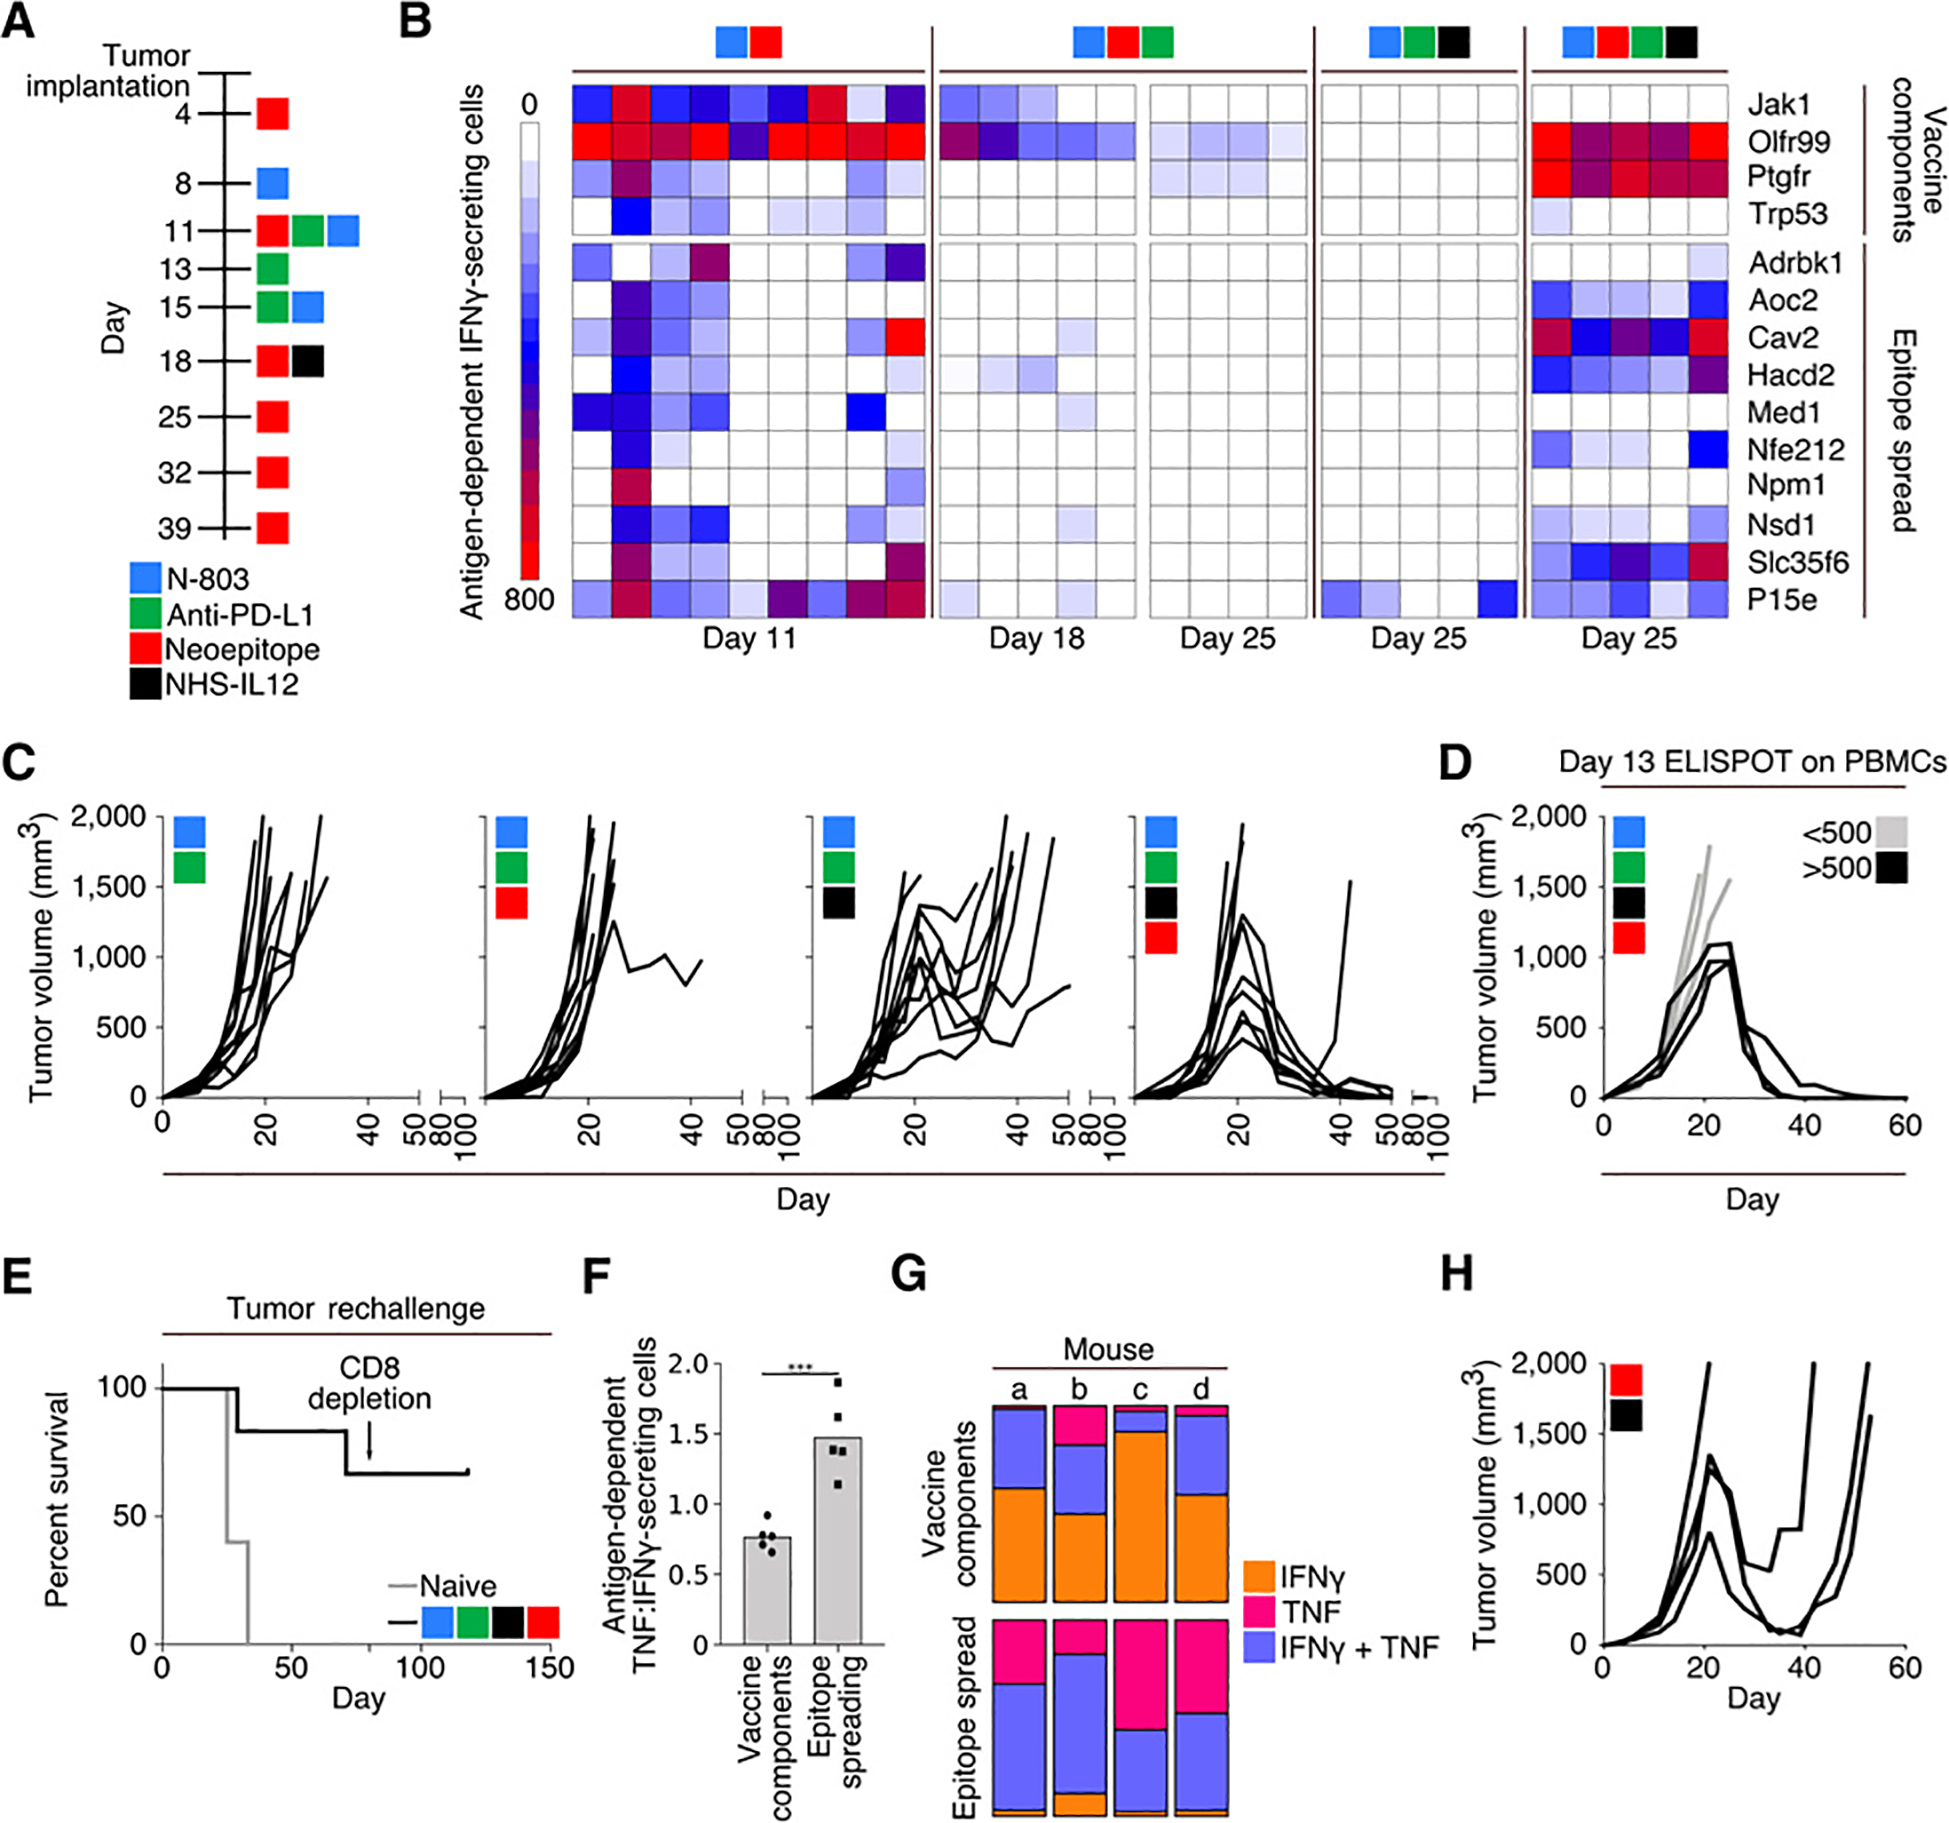
Combination therapy using a 9-mer neoepitope vaccine, N-803, anti–PD-L1, and NHS-IL12. A, Treatment schedule. B, IFNγ ELISPOT analysis on days 11, 18, and 25 of tumor growth against peptides contained within the vaccine (top) or MC38 neoepitopes not contained within the vaccine or P15e (bottom). Each column represents 1 mouse (n = 4–9). C, Tumor growth curves (n = 10). D, Tumor growth in mice treated with 9-mer neoepitope vaccine, N-803, anti–PD-L1, and NHS-IL12 stratified by antigen-specific IFNγ-secreting cells per 106 cells in the peripheral blood on day 13 (n = 6). E, Survival curves after rechallenge of naïve animals or those with a previously regressed MC38 tumor following indicated treatment. Rechallenged animals were implanted with MC38 tumors on day 0 of survival curve and received no subsequent therapies. Arrow indicates depletion of CD8+ cells (n = 6). F and G, Analysis of splenocytes from mice treated with 9-mer neoepitope vaccine, N-803, anti–PD-L1, and NHS-IL12, harvested on day 25 and stimulated overnight with either vaccine components or cascade antigens. F, ELISPOT analysis of the ratio of antigen-dependent TNFα:IFNγ-secreting splenocytes (n = 5). G, Flow cytometric analysis of percent of CD8+ cells that were single IFNγ (orange), single TNFα (pink), or double (purple) producers (n = 4). H, Tumor growth in mice treated with 9-mer neoepitope vaccine and NHS-IL12 according to the schedule in A (n = 4). Data are representative of 1 to 4 independent experiments.