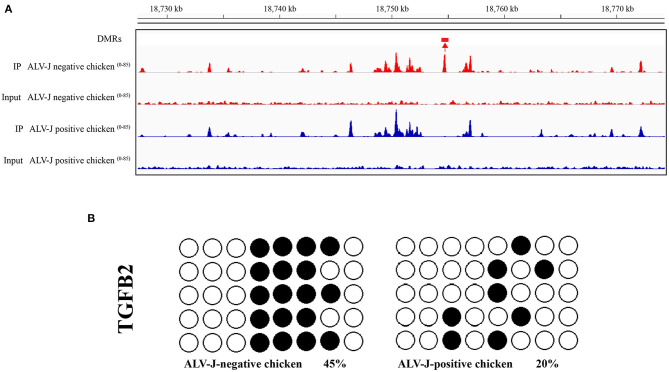
Figure 5.
Validation of the hypomethylated gene TGFB2 in ALV-J- positive chicken samples vs. ALV-J- negative chicken samples by bisulfite sequencing. (A) Visualization of the DMRs in TGFB2, using the IGV tool. DMR is indicated by boxes above the tracks. Scales are showed on the left; (B) the validation result of the DMRs of TGFB2 in the promoter region by bisulfate sequencing. Black circles indicate the methylated CpG locus and white circles indicate the unmethylated CpG locus. The chi-square test showed the differences between ALV-J-negative and ALV-J-positive chickens.

