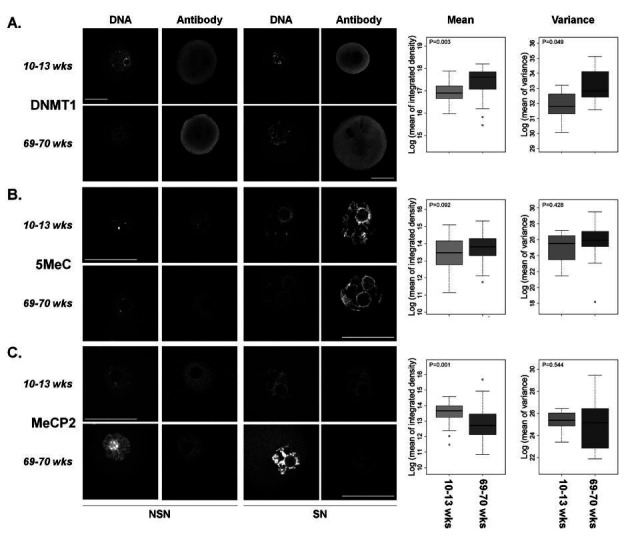
Figure 1. Immunofluorescent localization of DNA modifications/modifiers in fully-grown GV stage oocytes of young and aged female mice. Left panels: Shown are single confocal sections of the nucleus (GV; 5MeC, MeCP2) or oocyte (DNMT1). Left-most column are examples of oocytes with a non-surrounded nucleolus conformation (NSN = relaxed chromatin) and the right most column are micrographs of the surrounded nucleolus conformation (SN = contracted chromatin). No differentiation was made between these conformations for further analyses. Confocal settings were the same within each technical replicate. Stains used interchangeably to visualize DNA were YoYo1 Iodide or DRAQ7. Scale bar = 50 µm. Right panels: Shown are boxplots of the integrated density for each antibody (i.e. sum of all pixels above background; left) and variance of mean integrated density (right). The p-values are presented in the top left corner of each boxplot. Young mice = 10-13 weeks. Aged mice = 69-70 weeks. A. Data for DNMT1 from three trials representing 59 oocytes from 7 young mice and 49 oocytes from 15 aged mice. B. Data for 5MeC from six trials representing 133 oocytes from 13 young mice and 53 oocytes from 19 aged mice. C. Data for MeCP2 from four trials representing 75 oocytes from 8 young mice and 36 oocytes from 16 aged mice.

