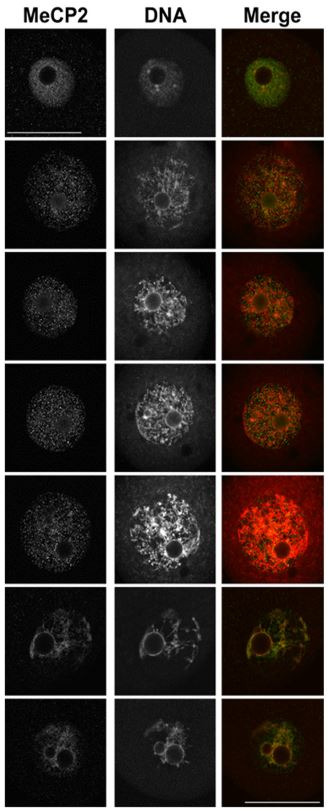
Figure 3. Confocal images for MeCP2 staining. Shown are single confocal sections of the nucleus (GV) displaying MeCP2 (left), DNA (middle), or a merged image of both stains (right). In the merged image, green represents MeCP2, red corresponds to DNA and yellow indicates areas of colocalization. Confocal settings were the same within each technical replicate. DNA stain = YoYo1 Iodide or DRAQ7. Note the lack of MeCP2 localization in chromocenters and nucleolar rings. Scale bar = 50 µm.

