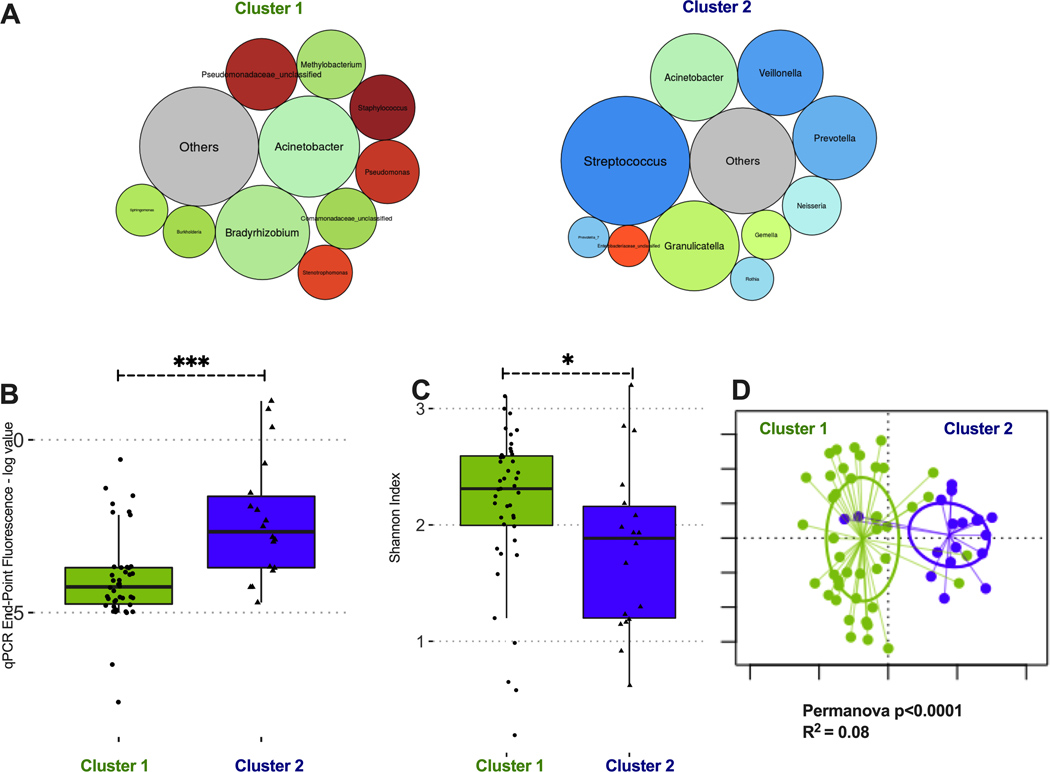
Figure 5: Dirichlet Multinomial Modeling clustering of IPF basilar tissue sample communities reveals two distinct taxonomic clusters.
(A) Summary relative abundance for top 10 genera in each cluster, visualized as bubble plot (diameter of each circle corresponds to relative abundance of each taxon across all samples in the cluster). Cluster 1 (n=44, 71% of samples) had high abundance for several genera that are not typical members of the respiratory microbiome and may represent procedural contamination (e.g. Bradyrhizobium, Methylobacterium, Comamonadaceae). Cluster 2 (n=18, 29% of samples) had high abundance of typical members of the respiratory microbiome (Streptococcus, Prevotella and Veillonella genera). Genera beyond the top 10 genera demonstrated in these bubble plots were summarized to their overall relative abundance as a single bubble in grey and annotated “Others”. (B) Cluster 2 had significantly higher bacterial load compared to cluster 1 (log-transformed end-point fluorescence of 16S rRNA gene quantitative polymerase chain reaction). (C) Cluster 2 had lower alpha diversity (Shannon index) compared to cluster 1. (D) Principal coordinates analysis for visualization of beta-diversity differences (Bray-Curtis dissimilarity) between Cluster 1 and Cluster 2 samples, demonstrating significant taxonomic compositional differences between clusters. P-values are obtained by Wilcoxon tests. *=p<0.05; ***=p-value <0.001.

