Fig. 6.
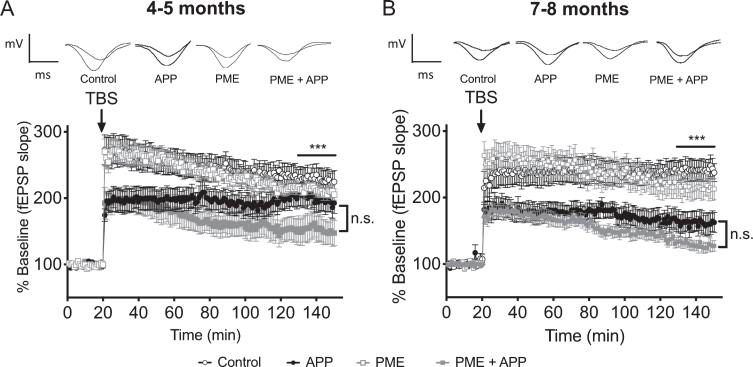
The effect of PME overexpression on LTP impairments in Tg2576 mice. A) Time course of averaged Schaffer collateral fEPSP responses (±SEM) prior to and following delivery of theta-burst stimulation (arrow) in hippocampal slices prepared from 4-5-month-old mice that carried the Tg2576 APP transgene in combination with transgenic PME overexpression (PME + APP), or 4-5-month-old animals that carried the Tg2576 APP transgene alone (APP), overexpressed PME alone (PME), or controls. 2-way RM ANOVA for fEPSP responses over the last 20 min of recording with group and time as factors shows a significant effect of group (horizontal bar; F(3,65) = 4.717, p = 0.0049), however, the trend for increased impairment in the PME + APP group relative to the APP alone group was not statistically significant (Dunnett’s multiple comparisons p = 0.1165). N = 17 control, 13 APP, 24 PME, 15 PME + APP. Representative traces of field potential responses prior to TBS, and during the last 20 min of recording are shown above for each of the indicated genotypes. B) Time course of averaged Schaffer collateral fEPSP responses (±SEM) prior to and following delivery of theta-burst stimulation (arrow) in hippocampal slices prepared from 7-8-month-old mice that carried the Tg2576 APP transgene in combination with transgenic PME overexpression (PME + APP), or 7-8-month-old animals that carried the Tg2576 APP transgene alone (APP), overexpressed PME alone (PME), or controls. 2-way RM ANOVA for fEPSP responses over the last 20 min of recording with group and time as factors shows a significant effect of group (horizontal bar; F(3,45) = 15.17, p < 0.0001); however, the trend for increased impairment in the PME + APP group relative to the APP alone group was not statistically significant (Dunnett’s multiple comparisons p = 0.2791). N = 11 control, 8 APP, 14 PME, 16 PME + APP. Representative traces of field potential responses prior to TBS, and during the last 20 min of recording are shown above for each of the indicated genotypes.

