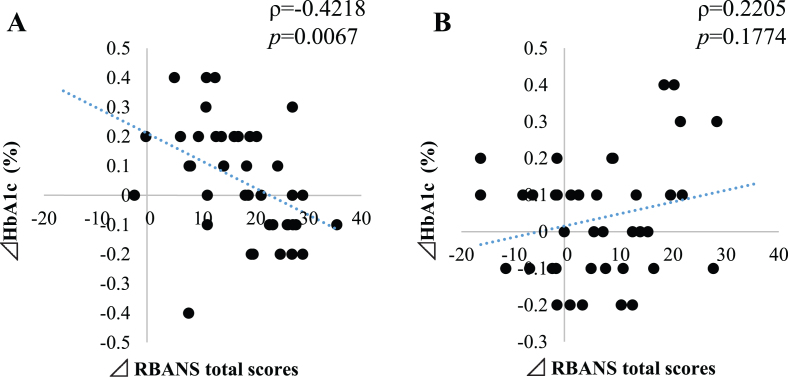
Fig. 1.
Correlation between changes of RBANS total scores with HbA1c of probiotic group (A) and placebo group (B). Y-axis represents percentage change in HbA1c and the X-axis represents the changes in RBANS total score. ρ represents the rho correlation and p represents the statistical significance of the correlation (Pearson analysis).

