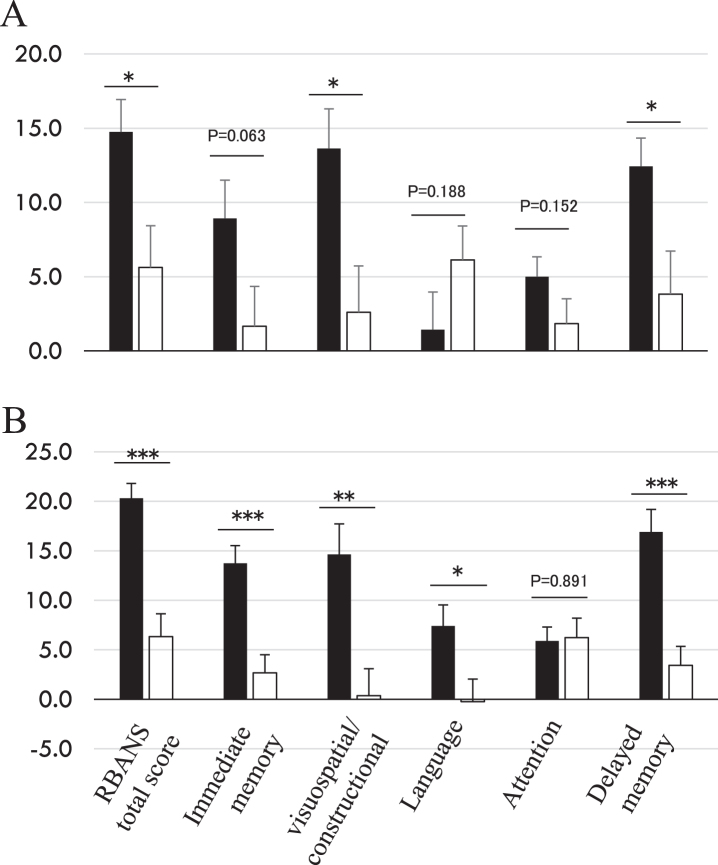
Fig. 2.
Changes of RBANS scores at 16 weeks from baseline. Stratified analysis based on baseline HbA1c median value (= 5.4%), lower group (A, < 5.4, probiotic n = 21, placebo n = 18) and higher group (B, ≥5.4, probiotic n = 19, placebo n = 21). ■: probiotic group; □: placebo group. Y-axis indicates RBANS score change from baseline. *p < 0.05, **p < 0.001, ***p < 0.0001, inter-group difference, Student’s t-test.

