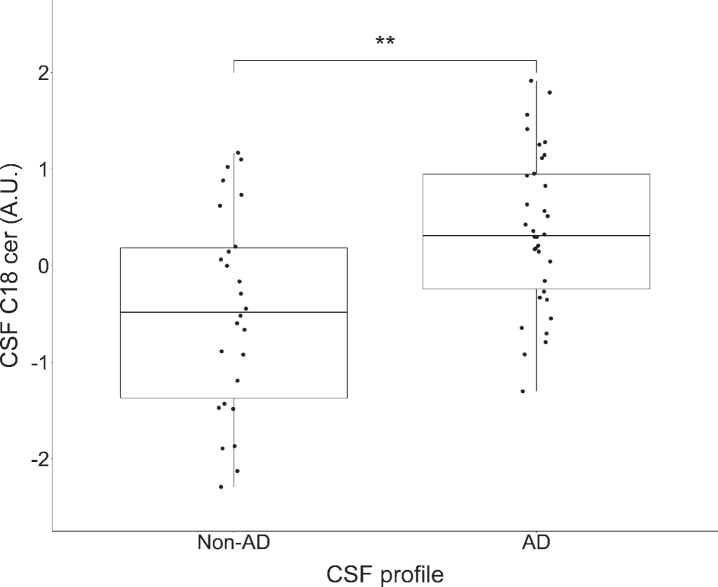
Fig. 3.
Comparison in levels of CSF C18 ceramide by CSF profile (non-AD and AD). *p < 0.05, **p < 0.01, ***p < 0.001 significance according to Mann-Whitney U non-parametric test. Based on normalized peak area arbitrary units (A.U.), log2-transformed and autoscaled before analysis. The lower and upper horizontal lines of the boxplot correspond to the 25th and the 75th centiles and the middle line to the median. Levels of CSF C18 ceramide were significantly higher (p = 0.002) among participants with a CSF AD profile compared to those without.

