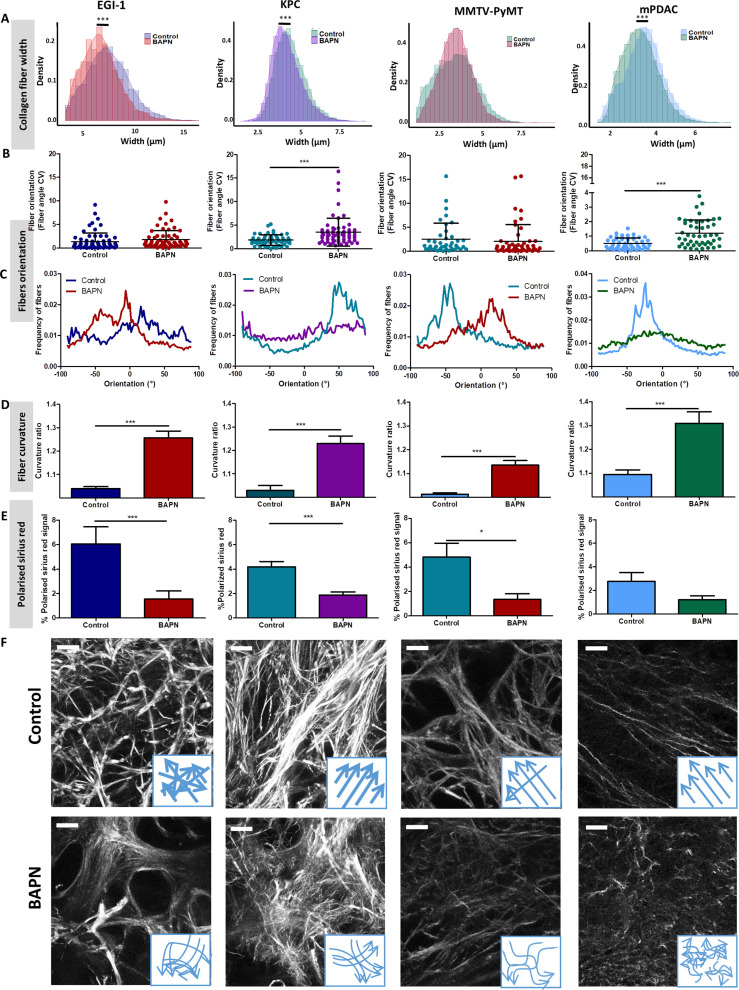
Figure 3. Effect of LOX inhibition on ECM architecture in EGI-1, KPC, MMTV-PyMT, and mPDAC tumor models.
(A) Collagen fiber width distribution measured from SHG images (***p-value<0.001, Student’s t-test, 50–70 images/tumor, n = 3 mice/group from three independent experiments). (B) Fiber orientation defined by the coefficient of variation (CV) (***p-value<0.001, Student’s t-test, 40–50 images/tumor, n = 3 mice/group from three independent experiments). (C) Representative example of fiber orientation distribution. (D) Collagen fiber curvature defined by the curvature ratio (***p-value<0.001, Student’s t-test, 40–50 images/tumor, n = 3 mice/group from three independent experiments). (E) Percentage of red-orange birefringent fibers combining Red Sirius staining and polarized microscopy, orange-red fibers correspond to thick and packed regions (*p-value<0.05, ***p-value<0.001, Student’s t-test, 20–30 images/tumor, n = 3 mice/group from three independent experiments). (F) SHG images of collagen networks in EGI-1, MMTV-PyMT, mPDAC, and KPC control and BAPN-treated tumors. Illustrative scheme indicating the changes in width, orientation and curvature of collagen fibers induced by BAPN treatment. Scale bar = 50 µm. Images are representative of three experiments.


