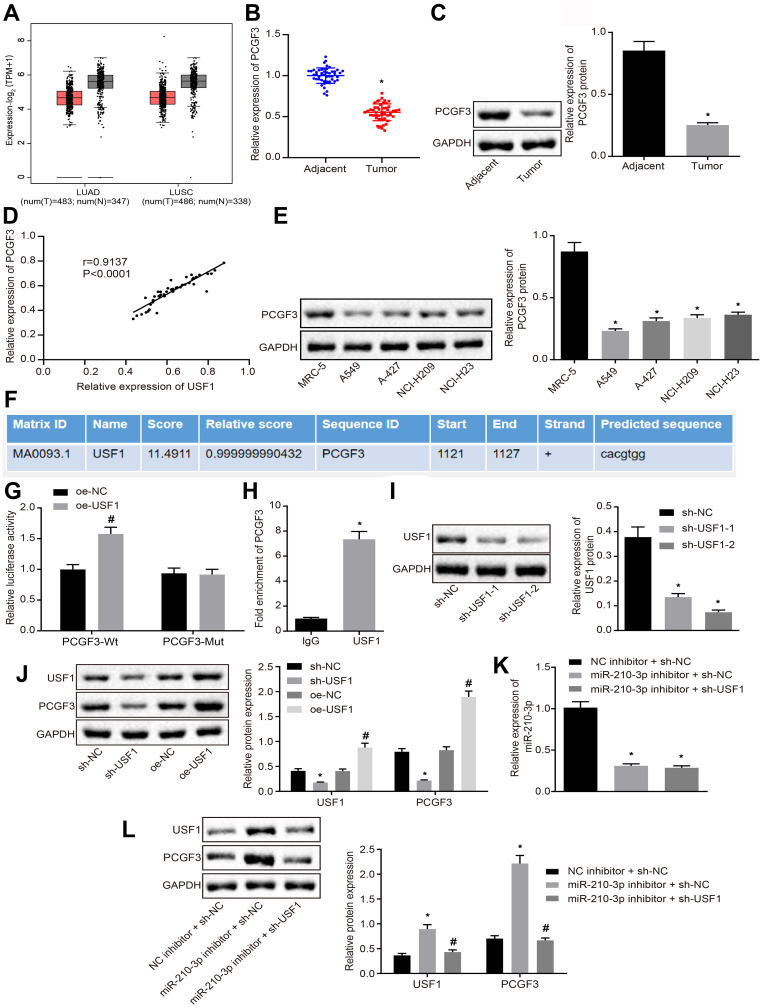
Figure 4.
miR-210-3p diminishes the activity of PCGF3 by targeting USF1 in A549 cells. (A) PCGF3 was poorly expressed in lung adenocarcinoma and lung squamous cell carcinoma compared to normal tissues in TCGA and GTEx databases. (B) Real-time qPCR examined the expression of PCGF3 in tumor lung tissues (n = 50) and matched tumor-free lung tissues (n = 50). (C) Immunoblots and quantification of PCGF3 in tumor lung tissues (n = 50) and matched tumor-free lung tissues (n = 50). (D) Pearson’s correlation analysis demonstrated a positive correlation between the expression of PCGF3 and USF1 in lung cancer tissues. (E) Immunoblots and quantification of PCGF3 in lung cancer cell lines (A549, A-427, NCI-H209, and NCI-H23) and MRC-5. (F) Putative USF1 binding sites in the PCGF3 promoter region by the JASPAR database analysis. (G) The luciferase activity at the promoter of the reporter gene containing PCGF3-Wt and PCGF3-Mut in response to USF1 overexpression treatment in HEK-293T cells. (H) Anti-USF1 immunoprecipitated more PCGF3 relative to IgG by ChIP assays. (I) Two sh-USF1s were designed and independently delivered into A549 cells to construct USF1 knockdown A549 cells. (J) Immunoblots and quantification of USF1 and PCGF3 in A549 cells with USF1 overexpression or knockdown. (K) Real-time qPCR examined the expression of miR-210-3p in A549 cells treated with miR-210-3p inhibitor alone or with sh-USF1. (L) Immunoblots and quantification of USF1 and PCGF3 in A549 cells treated with miR-210-3p inhibitor alone or sh-USF1. *p < 0.05 compared to matched adjacent tumor tissues by paired t-test, to sh-NC or IgG by unpaired t-test, to MRC-5 or NC inhibitor + sh-NC by ANOVA adjusted by Tukey’s test. #p < 0.05 compared to oe-NC by unpaired t-test and to miR-210-3p inhibitor + sh-NC by ANOVA adjusted by Tukey’s test.

