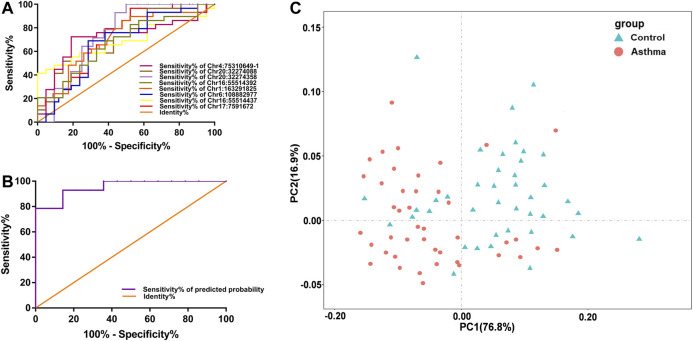
FIGURE 4.
Accuracy of the methylation level of the 8 DMSs in distinguishing asthma patients from HCs. (A) ROC curve analysis of differential CpG sites Chr4:75310649-1, Chr20:32274088, Chr20:32274358, Chr6:108882977, Chr16:55514392, Chr16:55514437, Chr1:163291825, and Chr17:7591672, respectively. (B) The ROC curve of the predicted probability of the 8 DMSs. (C) A PCA plot consisting of the methylation levels of the 8 DMSs in HCs and asthma patients.

