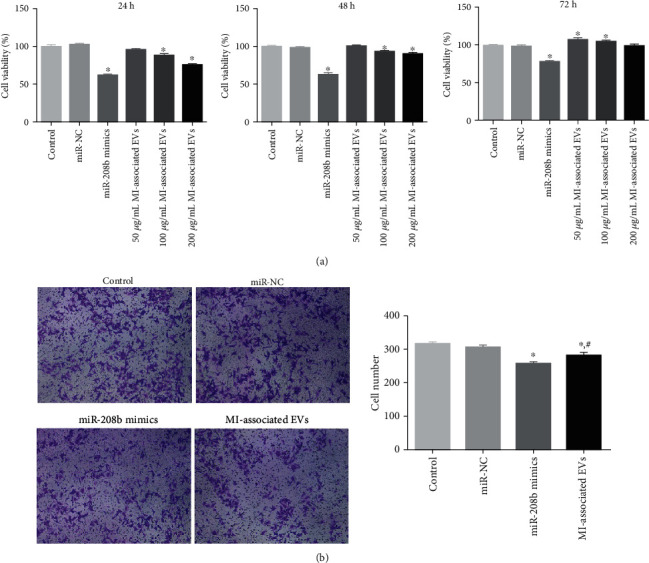
Figure 5.

(a) The viability of HUVECs following the different treatments for 24 h, 48 h, and 72 h, determined by Cell Counting Kit-8 (CCK-8), n = 3. (b) HUVECs were treated with 100 μg/mL MI-associated EVs for 24 h, and the migration of HUVECs following the different treatments was determined by the Transwell assay. Left: images showing crystal violet staining under a microscope (at the magnification of 100x). Right: cell number of the different groups, n = 3. ∗P < 0.05, compared with the control group. #P < 0.05, compared with the miR-208b mimic group.
