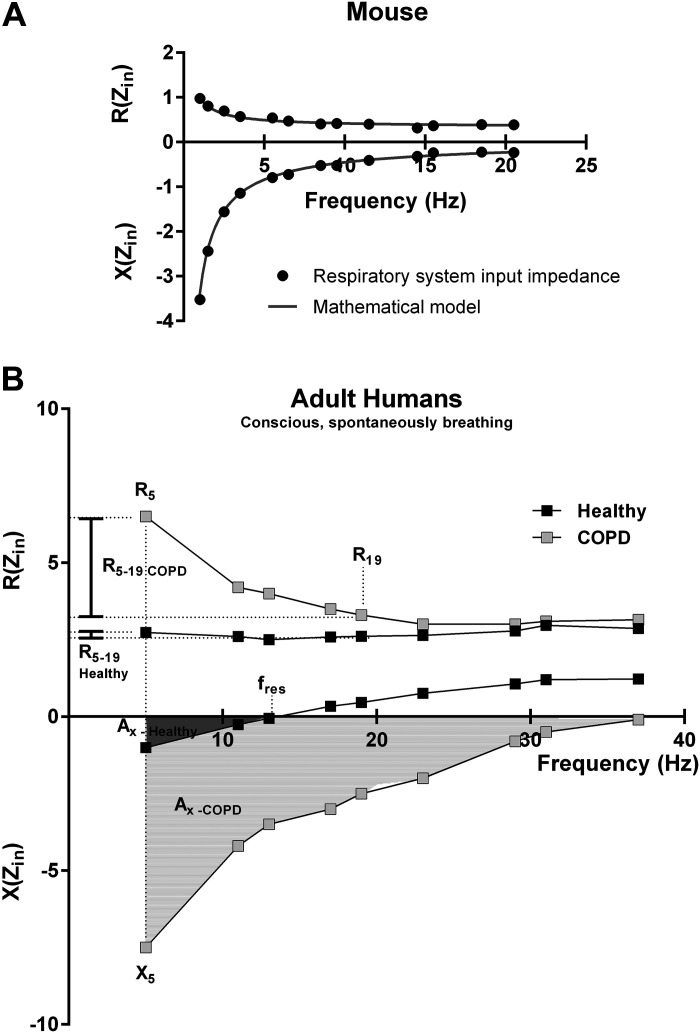
Figure 1.
Interpretation of preclinical and clinical impedance spectra. A: mouse impedance spectra obtained with a flexiVent FX (SCIREQ Inc., Montréal, QC, Canada). At the preclinical level, mathematical models, such as the constant phase model (88), are often used to fit the impedance data providing parameters used to interpret respiratory impedance spectra. B: human impedance spectra from a normal subject and a chronic obstructive pulmonary disease (COPD) patient obtained with a tremoflo C-100 (Thorasys Inc., Montréal, QC, Canada). Clinical oscillometry relies on qualitative and quantitative analyses of the shape of the frequency response to interpret human impedance spectra as mathematical models are yet to be developed. Zin, input impedance; R(Zin), resistance part of input impedance; X(Zin), reactance portion of input impedance. Both parts of the impedance spectra are expressed in cmH2O·s/mL in mice and cmH2O·s/L in humans. The vertical dash line indicates the lowest frequency (5 Hz) used in a typical oscillometry measurement in a conscious, spontaneously breathing human subjects. R5, resistance at 5 Hz, considered to pertain to the entire respiratory system; R19, resistance at 19 Hz, reflecting primarily the contribution from the central airways; R5-19, difference between resistance at low and higher frequencies, a measure of airway heterogeneity; X5, reactance at 5 Hz, assessing the elastance of the respiratory system; AX, area over the reactance curve; fres, resonant frequency. Values of human COPD impedance were extracted from Peters et al. (81). Human healthy impedance was generated internally and represents unpublished data from a female subject.

