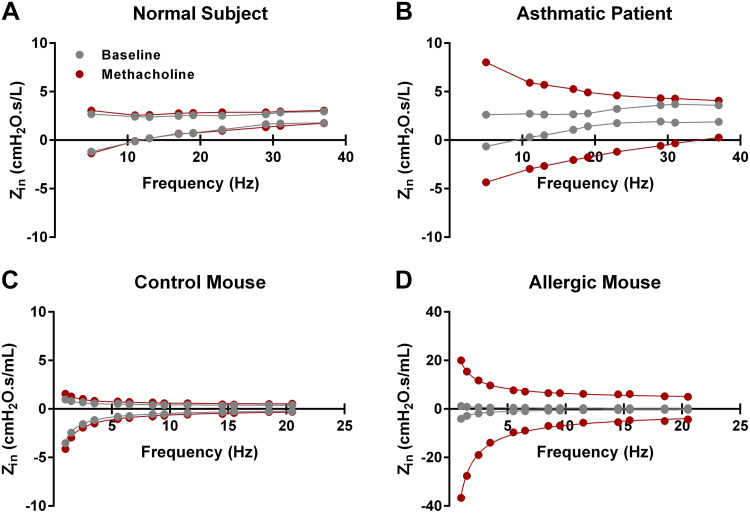
Figure 3.
Human and mouse input impedance spectra at baseline and following a bronchoprovocation with methacholine. A and B: impedance spectra from a normal subject (A) and an asthmatic patient (B) recorded under baseline conditions and following an inhaled methacholine challenge at 2 mg/mL (data courtesy of Dr. Y. Bossé). C and D: impedance spectra from a control mouse (C) and a chronic allergic model (D) before and after an aerosolized challenge with methacholine at 12.5 mg/mL (data generated internally). Mouse data were obtained with a flexiVent FX and human data with a tremoflo C-100. Zin, input impedance.

