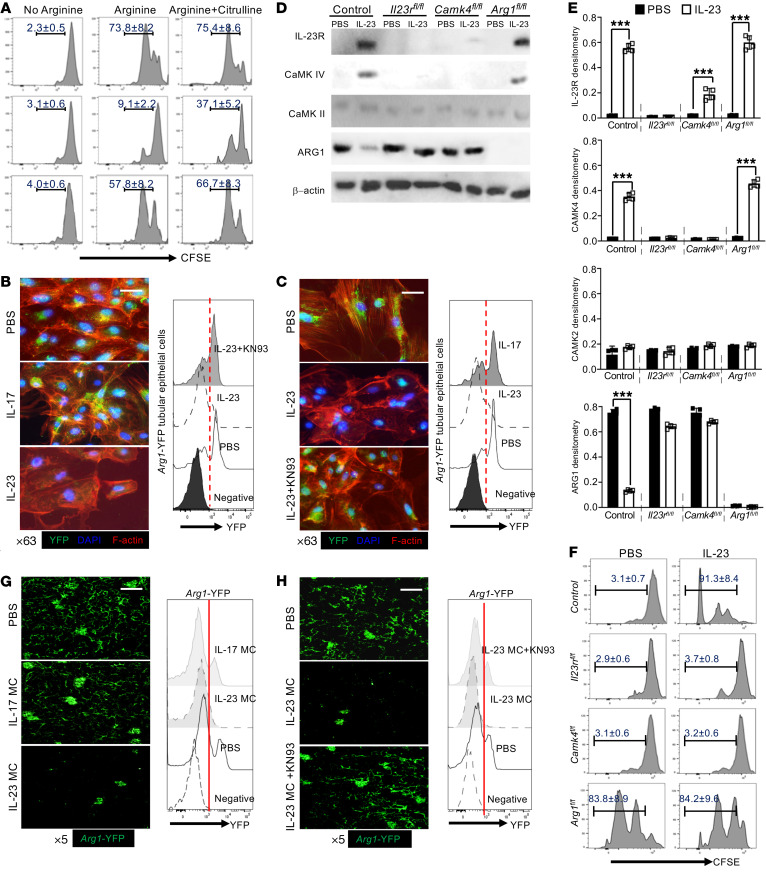
Figure 3. Tubular epithelial IL-23 signaling enables T cell proliferation in coculture.
(A) Flow cytometric analysis of in vitro proliferative response (CFSElo) of purified splenic CD4+ T cells cocultured with primary TECs or IL-23–prestimulated TECs for 72 hours in arginine-deficient media with or without addition of arginine or citrulline. T cells were stimulated with anti-CD3 and anti-CD28. Primary proximal TECs were isolated from Arg1-eYFP B6 mice and selectively enriched in vitro. ARG1 expression was tracked by fluorescence intensity of YFP. (B and C) Left: Immunofluorescence image analysis for YFP expression (ARG1) with phalloidin-counterstained F-actin (red) and DAPI (blue) in cultured TECs with the indicated cytokine stimulation (B) or stimulated in the presence of IL-23 for 72 hours with or without CaMK4 inhibitor (KN93) and PBS as control (C). Magnification, ×63; scale bar: 10 μm. Right: Flow cytometric quantification of ARG1 expression. Primary proximal TECs were isolated from mice with the indicated gene deficiency and selectively enriched in vitro. All mice were Cdh16-cre+. Cells were stimulated with IL-23 or PBS for 48 hours for Western blots (D) and quantification (E) of the expression of the indicated proteins. (F) Flow cytometric analysis of in vitro proliferative response (CFSElo) to anti-CD3 plus anti-CD28 of purified splenic CD4+ T cells cocultured 72 hours with the indicated proximal TECs with or without IL-23 stimulation. Arg1-eYFP B6 mice were injected with the indicated MC for 48 hours and KN93 was i.p. injected 2 hours after MC administration. (G and H) Left: Representative confocal microscopic images of renal YFP (ARG1) for mice subjected to the indicated MC administration (G) or mice administered IL-23 MC with or without addition of KN93 (H). Magnification, ×5; scale bar: 150 μm. Right: Flow cytometric quantification of ARG1 expression; cells from naive B6 mice were used as negative control. Data represent the mean ± SEM; n = 4–6 per group in each experiment for 2 independent experiments. ***P < 0.005 by Student’s t test.

