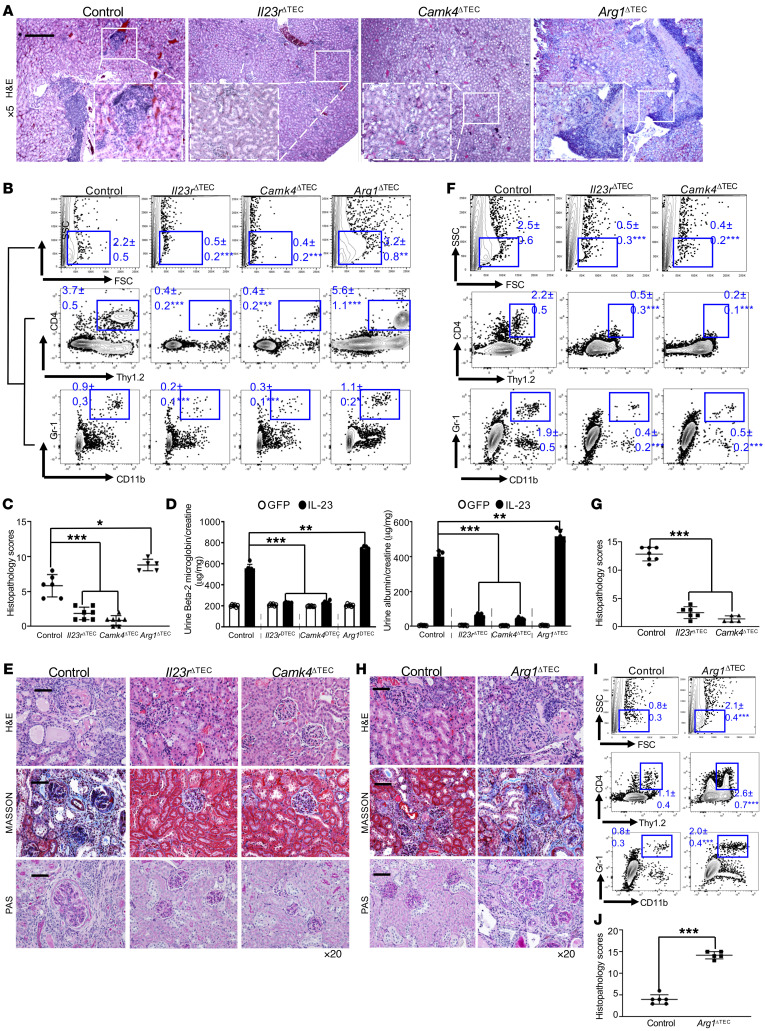
Figure 4. Genetic deficiency of Il23r or Camk4 ameliorates, but deficiency of Arg1 exaggerates, renal inflammation in mice.
All mice were Cdh16-cre+: Cdh16-Cre (control), Cdh16-Cre × Il23rfl/fl (Il23rΔTEC), Cdh16-Cre × Camk4fl/fl (Camk4ΔTEC), and Cdh16-Cre × Arg1fl/fl (Arg1ΔTEC). Eight-week-old mice with the indicated genotype were injected with IL-23 MC for 90 days (A–C). (A) Representative images of H&E-stained kidney sections from the indicated mice; boxed areas were digitally magnified. Magnification, ×5; scale bar: 200 μm. (B) Flow cytometric quantification of infiltrating CD4+ T cells and activated macrophages/neutrophils in kidneys. (C) Histopathologic scoring of kidneys from the indicated mice. (D) ELISA quantification of protein in urine from the indicated mice. Left: Urine β-2-microglobulin from the indicated mice. Right: The mean ratio of urine albumin and creatinine from the indicated mice. **P < 0.01, ***P < 0.005 versus control by 2-way ANOVA. Sheep anti–mouse glomerular basement membrane (anti-GBM) serum (100 μL in E–G or 50 μL in H–J) was administered to 8-week-old mice with the indicated genotype for 21 days for the induction of immune-mediated glomerulonephritis. (E) Representative images of H&E, PAS, and Masson’s trichrome staining of kidneys from the indicated 3 groups of mice subjected to sheep anti–mouse GBM serum. Magnification, ×20; scale bar: 40 μm. (F) Flow cytometric quantification of infiltrating CD4+ T cells and activated macrophages/neutrophils in kidneys. (G) Histopathologic scoring of kidneys from the indicated mice. (H) Representative images of H&E, PAS, and Masson’s trichrome staining of kidneys from the indicated 2 groups of mice subjected to sheep anti–mouse GBM serum. Magnification, ×20; scale bar: 40 μm. (I) Flow cytometric quantification of infiltrating CD4+ T cells and activated macrophages/neutrophils in kidneys. (J) Histopathologic scoring of kidneys from the indicated mice. Data represent the mean ± SEM; n = 5–7 mice per group in each experiment for 2 independent experiments. *P < 0.05, **P < 0.01, ***P < 0.005 versus control by Student’s t test.

