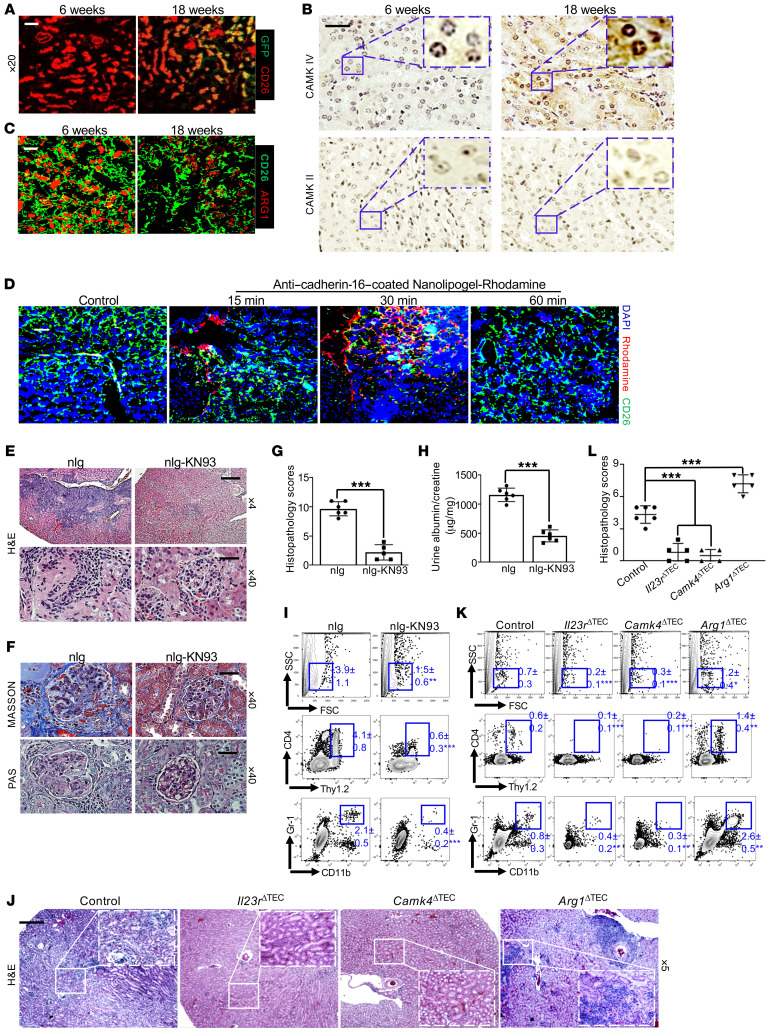
Figure 5. TEC-targeted delivery of the CaMK4 inhibitor KN93 efficiently suppresses renal inflammation in lupus-prone MRL.lpr mice.
(A) Cryosection of kidneys from female Il23r-GFP MRL.lpr mice at the indicated ages stained for CD26 (red). Magnification, ×20; scale bar: 20 μm. (B) Immunohistochemical staining of CaMK4 (left) and CaMK2 (right) in the kidneys of female MRL.lpr mice at the indicated ages; boxed areas were digitally magnified. Magnification, ×40; scale bar: 25 μm. (C) Cryosection of kidneys from in MRL.lpr mice at the indicated ages stained for ARG1 (red) and CD26 (green). Magnification, ×20; scale bar: 20 μm. (D) Ten-week-old MRL.lpr mice were administered anti–cadherin-16–coated nanolipogel–rhodamine and euthanized after the indicated time for analysis. Confocal microscopic images show the targeted delivery by rhodamine+ cells in representative kidney areas. Magnification, ×10; scale bar: 50 μm. (E–I) Ten-week-old MRL.lpr mice were administered anti–cadherin-16–coated empty nanolipogels (nlg) or nanolipogel-KN93 every 10 days for a total of4 times. Representative images of kidney sections stained with H&E (E) and Masson’s trichrome and PAS (F) with the indicated magnification. Scale bar: 200 μm (×4 magnification) and 25 μm (×40 magnification). (G) Histopathologic scoring of kidneys. (H) The mean ratio of urine albumin and creatinine. (I) Flow cytometric quantification of infiltrating CD4+ T cells and activated macrophages/neutrophils in kidneys. (J–L) Bone marrow (BM) reconstitution was carried out by transferring BM from 2-month-old B6.lpr mice to lethally irradiated indicated recipients for 10 months. All recipients were Cdh16-cre+: Cdh16-Cre (control), Cdh16-Cre × Il23rfl/fl (Il23rΔTEC), Cdh16-Cre × Camk4fl/fl (Camk4ΔTEC), and Cdh16-Cre × Arg1fl/fl (Arg1ΔTEC). (J) Representative H&E images of kidneys from the indicated mice; boxed areas were digitally magnified. Magnification, ×5; scale bar: 200 μm. (K) Flow cytometric quantification of CD4+ T cells and activated macrophages/neutrophils in kidneys. (L) Histopathologic scoring of kidneys. Data represent the mean ± SEM; n = 4–6 mice per group in each experiment for 2 independent experiments. *P < 0.05, **P < 0.01, ***P < 0.005 versus control by Student’s t test (G and H) or 2-way ANOVA (K and L).

