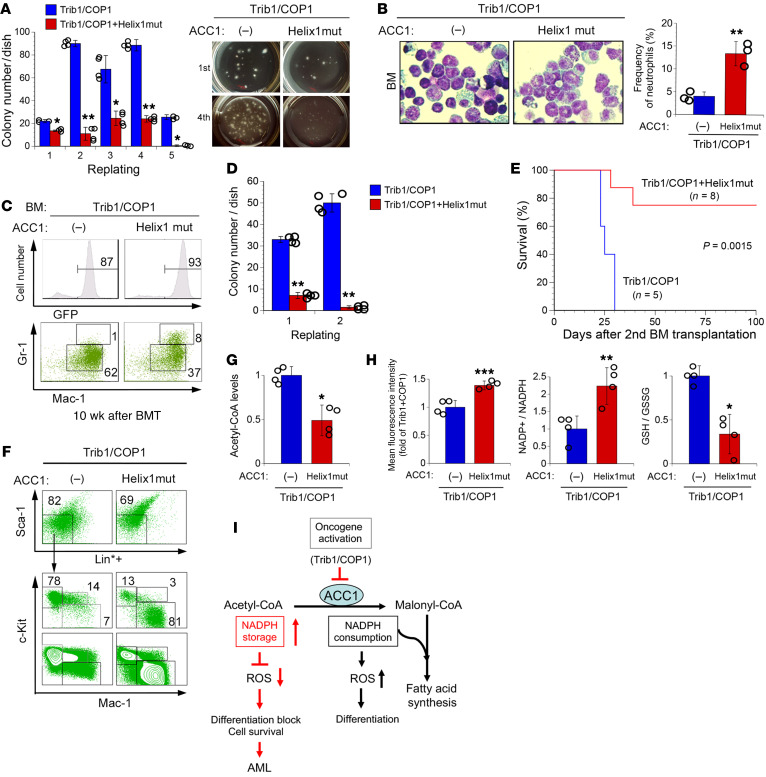
Figure 6. ACC1 stabilization induces the loss of self-renewal activity in leukemia-initiating cells.
(A and B) GFP-positive BM cells expressing Trib1/COP1 together with and without Helix1mut were sorted and plated in methylcellulose-based medium. Colony numbers were counted after 10 days and replated in fresh medium for serial colony assays (A, left panel). Plates from the first culture and the fourth serial culture are shown (A, right panel). May-Grünwald-Giemsa stain (original magnification, ×400) and frequency of neutrophils (n = 3) in colony-forming cells from the first culture (B). (C–H) BM cells from the early phase of Trib1-COP1 control mice and mice with Helix1mut-cotransduced BM (10 weeks after BM transplantation) were analyzed. (C) FACS analysis for immature (Mac-1+Gr-1lo) and differentiated (Mac-1hiGr-1hi) granulocytes. The population of GFP-positive cells in BM is shown in the top panels. (D) GFP-positive cells were sorted and plated for colony assays. (E) Kaplan-Meier survival curves of secondary transplanted mice. Sublethally irradiated mice received 1 × 10⁵ GFP-positive BM cells each from two Trib1/COP1 and two Helix1mut mice. (F) A detailed FACS analysis of GFP-positive BM cells from secondary transplanted mice in E. Lin*–Sca-1– cells were separated into 3 fractions: c-KithiMac-1– (fraction A), c-Kit+Mac-1+ (fraction B), and c-Kitlo/–Mac-1+ (fraction C). (G and H) GFP-positive BM cells from the early phase of Trib1/COP1 (n = 4) and Helix1mut (n = 4) mice were analyzed to measure acetyl-CoA levels (G), ROS levels, the NADP+/NADPH ratio, and the GSH/GSSG ratio (H). (I) Proposed model of the ACC1-mediated pathway and effects on leukemia cells. P values were calculated by Student’s t test (*P < 0.05, **P < 0.01, ***P < 0.001) in A, B, D, G, and H and by log-rank test in E. Data are the average of 2 independent experiments with 4 dishes (A and D) and 4 independent experiments (G and H) shown as mean ± SEM.

