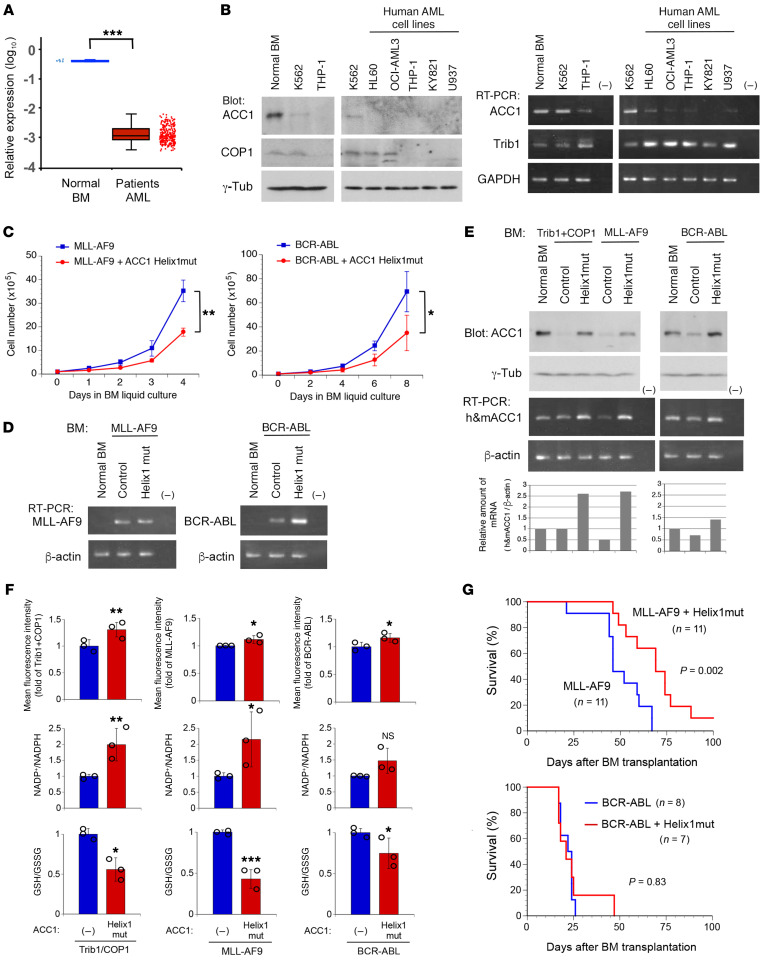
Figure 7. ACC1 is downregulated in human AML and stabilized ACC1 partially suppresses MLL-AF9–induced AML.
(A) Microarray data analysis of the ACC1 expression in human AML. Gene expression data of normal BMs from healthy donors (n = 9) and AML patient samples (n = 285) were obtained from the GEO data sets. (B) ACC1 protein and mRNA levels in human leukemic cell lines. Cell lysates from normal BM, a CML cell line (K562), and AML cell lines (HL60, OCI-AML3, THP-1, KY821, and U937) were analyzed by immunoblotting with antibodies against ACC1, COP1, and γ-tubulin. Total RNA was analyzed by semi-qRT-PCR using a pair of primers specific to ACC1, Trib1, and GAPDH. (C–F) Primary BM cells were infected with retroviruses expressing MLL-AF9, BCR-ABL, and Trib1- and COP1-IRES-GFP together with and without ACC1 Helix1mut. Sorted GFP-positive cells were cultured in BM medium. Cell numbers were counted for growth curves (C). Total RNA extracted from GFP-positive cells in C was analyzed by semi-qRT-PCR using a pair of primers specific to MLL-AF9, BCR-ABL (D), human and mouse (h&m) ACC1 (E), and β-actin (D and E). Cell lysates of GFP-positive cells in C were analyzed by immunoblotting with antibodies against ACC1 and γ-tubulin (E). Relative amounts of mRNAs (h&mACC1/β-actin) were quantified using ImageJ software (E, bottom panels). GFP-positive cells in C were transferred to IL-3–containing medium with low glucose (1 g/L) and analyzed to measure ROS levels, the NADP+/NADPH ratio, and the GSH/GSSG ratio (F). Data are the average of 3 independent experiments (C and F) shown as mean ± SEM. (G) Survival curves of transplanted mice with BM expressing MLL-AF9-IRES-GFP and BCR-ABL-IRES-GFP together with and without ACC1 Helix1mut. Results are derived from 3 independent transfer experiments. P values were calculated with Student’s t test (*P < 0.05, **P < 0.01, ***P < 0.001) in A, C, and F and with log-rank test in G.

