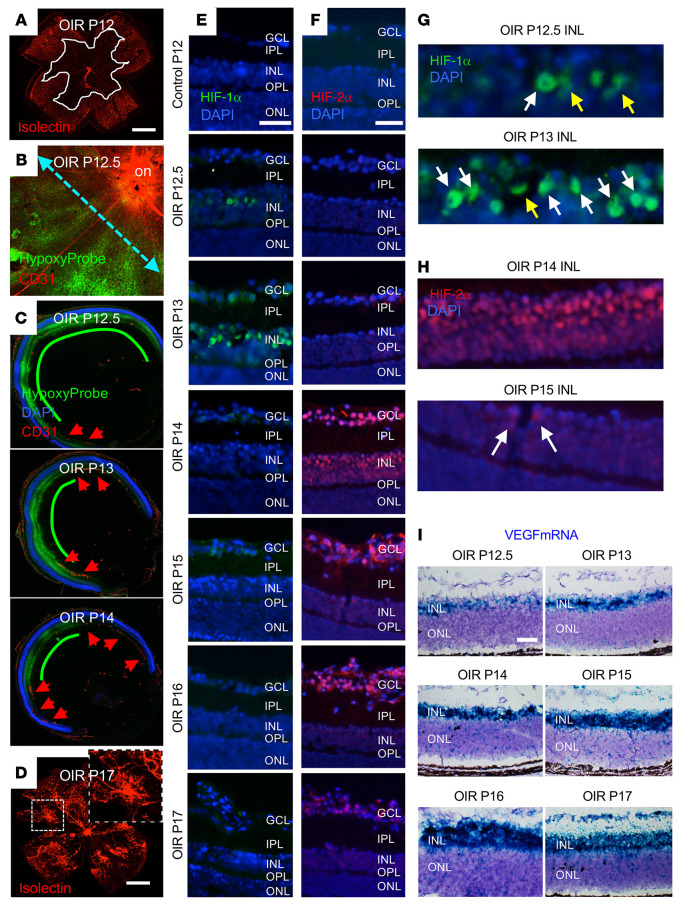
Figure 9. Coordinated expression of HIF-1α and HIF-2α promotes VEGF expression in the OIR mouse model.
(A and B) Retina flat mounts demonstrating vaso-obliteration (demarcated by white line in A) and hypoxia (as measured by Hypoxyprobe staining in B) in the posterior retina at the initiation of the ischemic stage (P12) of the OIR model. Cyan dashed line represents the location of cross-sections used for subsequent IF studies. (C) Representative images of cross-section of OIR eye demonstrating decrease in hypoxia (as measured by Hypoxyprobe) in the posterior inner retina from P12.5 to P14 with revascularization in the peripheral retina (red arrowheads) that progressed posteriorly. (D) Representative image of retinal NV at P17. (E and F) The accumulation of HIF-1α (E) and HIF-2α (F) in the hypoxic inner retina during the ischemic stage of the OIR model (P12–P17). (G and H) Nuclear (white arrows) versus cytoplasmic (yellow arrows) accumulation of HIF-1α (G) and HIF-2α (H) in the INL. (I) Increased Vegf mRNA expression in the ischemic inner retina beginning at P13 and peaking between P15 and P16 by RNAscope. n = 4–6 animals. on, optic nerve; GCL, ganglion cell layer; IPL, inner plexiform layer; INL, inner nuclear layer; OPL, outer plexiform layer; ONL, outer nuclear layer. Scale bars: 500 μm (A–D); 100 μm (E–J).

