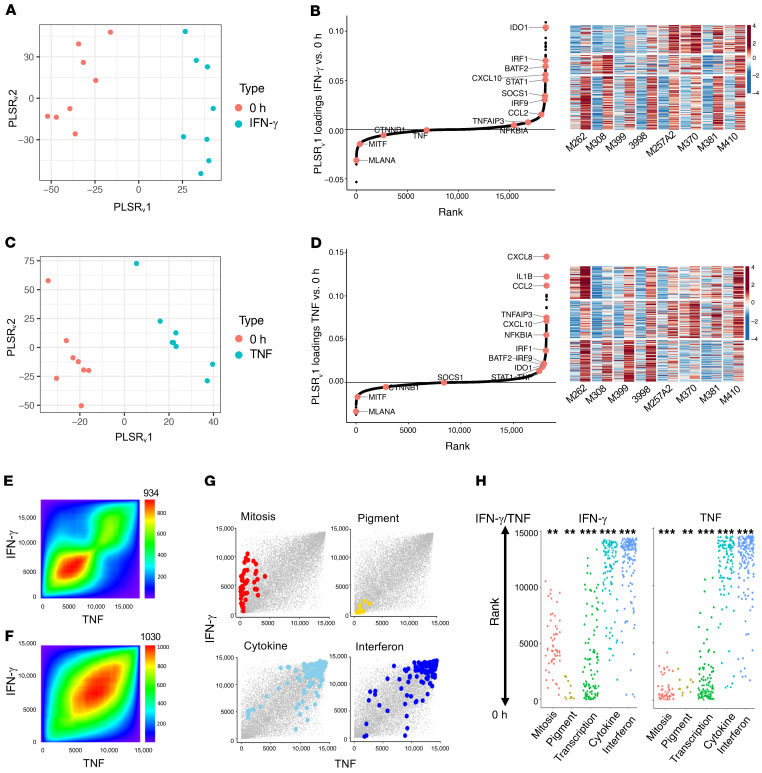
Figure 3. IFN-γ and TNF stimulation induces the expression of common genes across cell lines to generate comparable MART-1–low/NGFR-high dedifferentiation states.
(A) Varimax-rotated PLSR on IFN-γ–exposed samples compared with 0-hour (untreated) samples. (B) Left: Genes contributing to a common IFN-γ response across samples. Right: K-means clustering of top 300 gene loadings. Left column shows untreated and right column shows after IFN-γ exposure for each cell line. (C) Varimax-rotated PLSR on TNF compared with untreated samples. (D) Left: Genes contributing to a TNF response across samples. Right: K-means clustering of top 300 gene loadings. Left column shows untreated and right column shows after TNF exposure for each cell line. (E) Overlap of IFN-γ– and TNF-induced gene expression by ranked loadings. (F) Concordant GO term overlap (NESs) between IFN-γ– and TNF-induced gene expression. The number shown at the top of E and F is the maximum –log10(P value) of the RRHO heatmap. (G and H) Enrichment of gene sets involving pigmentation, mitosis, transcription, IFN signaling, and cytokines following IFN-γ or TNF exposure. *P < 0.1, **P < 0.01, and ***P < 0.001, by signed KS test.

