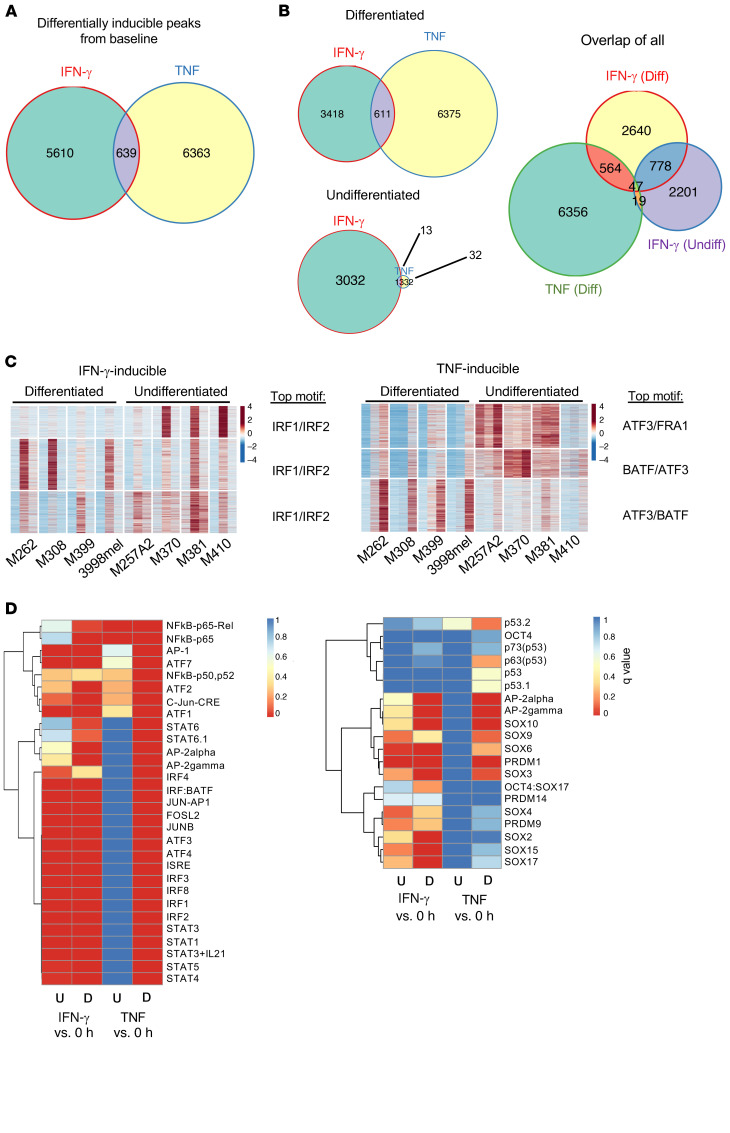
Figure 5. The basal chromatin landscapes of differentiated and undifferentiated lines result in distinct epigenomic responses upon cytokine stimulation.
(A) Overlap of induced IFN-γ and TNF ATAC-Seq peaks. (B) Overlap of peaks separated by cell line baseline state. (C) Heatmap of differentially IFN-γ–inducible peaks for baseline differentiated and undifferentiated cell lines, with the top motif for each cluster listed (subcolumns are in the order 0 hour, IFN-γ, and TNF for each cell line), and heatmap of differentially TNF-inducible peaks for baseline differentiated and undifferentiated lines, with the top motif for each cluster listed. (D) Motif enrichment of IFN-γ– compared with TNF-inducible peaks for baseline differentiated and undifferentiated cell lines separately. Colors represent q values.

