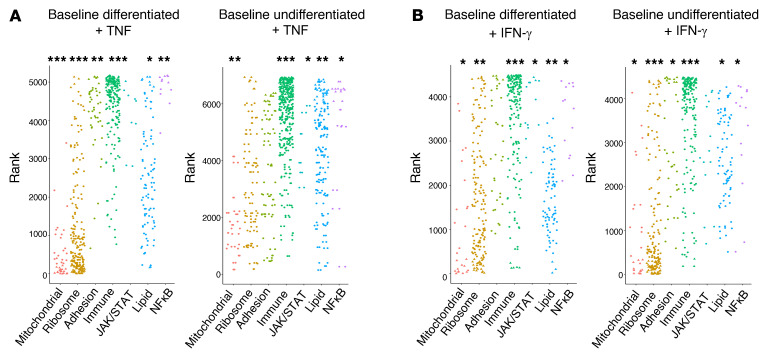
Figure 7. Gene expression differences between differentiated and undifferentiated cell lines may be attributed to lipid, ribosomal, mitochondrial, and adhesion processes.
(A and B) Enrichment of gene set groups (C5: GO gene sets), based on ranked lists of differentially expressed genes, for TNF and IFN-γ.*P < 0.1, **P < 0.01, and ***P < 0.001, by signed KS test.

