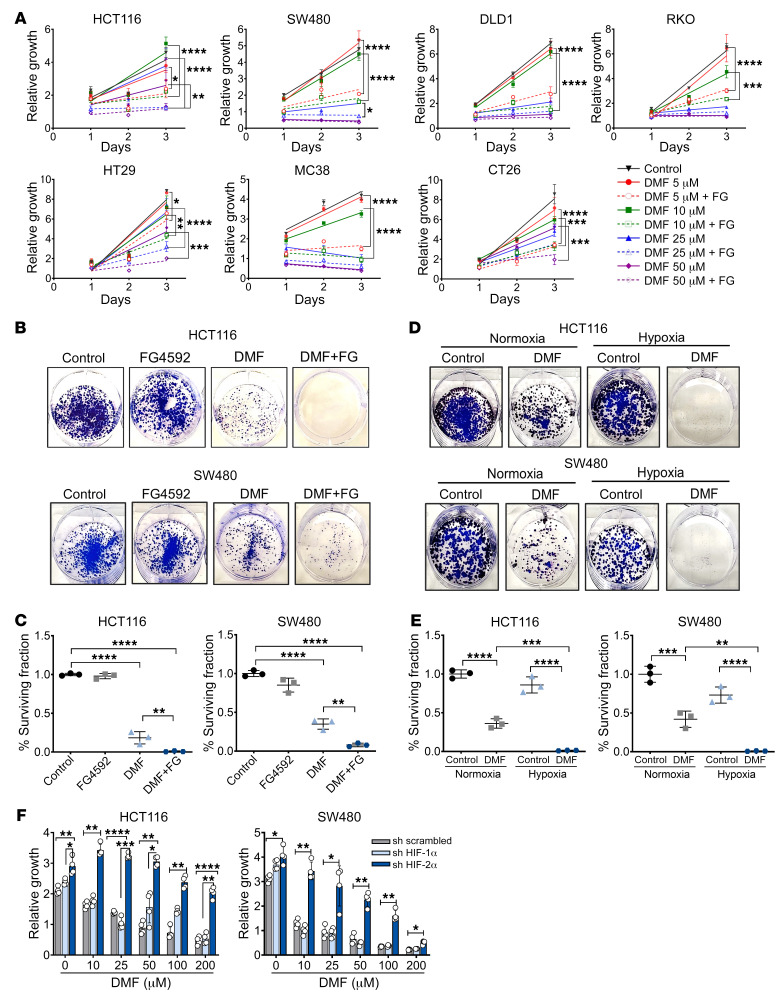
Figure 3. Hypoxia mimetic contributes to DMF-induced growth inhibition in CRC cells.
(A) Cell-growth assay following FG4592 (100 μM) and DMF cotreatment. Error bars represent mean ± SD. Statistical significance was calculated using 1-way ANOVA followed by Tukey’s multiple comparisons test. *P < 0.05; **P < 0.01; ***P < 0.001; ****P < 0.0001. (B) Representative images and (C) quantitation of colony-forming assays in HCT116 and SW480 cells treated with DMF (25 μM), or FG4592 (100 μM) or cotreated with DMF and FG4592. (D) Representative images and (E) quantitation of colony-forming assays in HCT116 and SW480 cells treated with DMF (25 μM) and cultured under normoxic and hypoxic conditions. Quantitative data are represented as mean ± SD from 3 independent experiments. Statistical significance was calculated using 1-way ANOVA with Tukey’s multiple comparisons. **P < 0.01; ***P < 0.001; ****P < 0.0001. (F) Growth assay of HIF-1α and HIF-2α knockdown HCT116 and SW480 cells treated with DMF alone or in combination with FG4592 (100 μM). Quantitative data are represented as mean ± SD from 3 independent experiments. Statistical significance was calculated using 2-way ANOVA with Tukey’s multiple comparisons. *P < 0.05; **P < 0.01; ***P < 0.001; ****P < 0.0001

