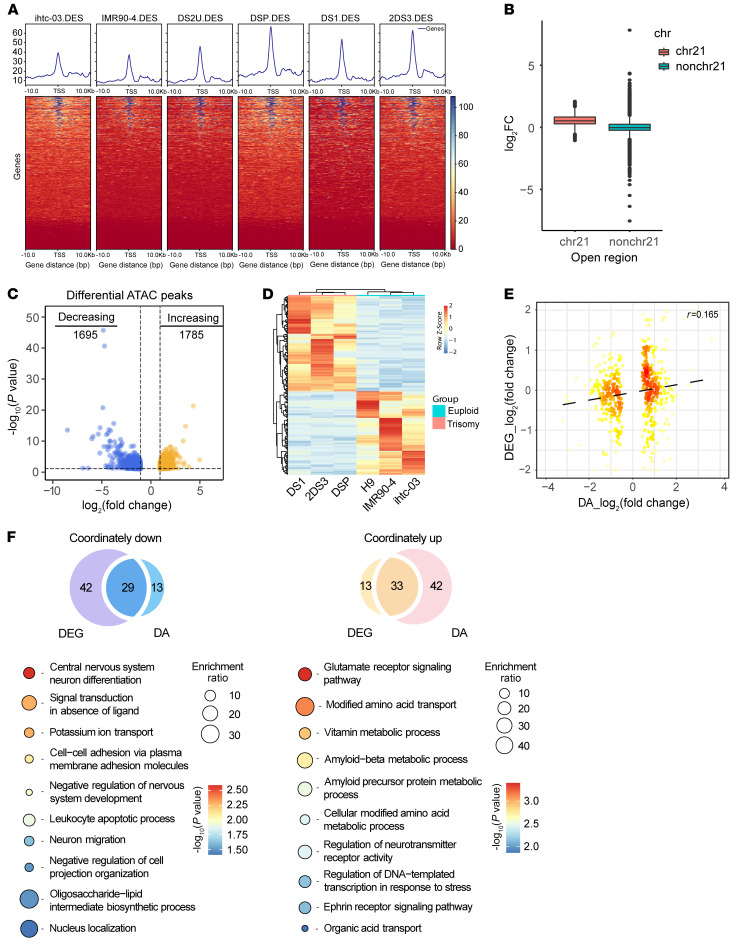
Figure 2. Transcriptional and ATAC-Seq analyses in cerebral organoids derived from trisomy 21 and euploid PSCs.
(A) Heatmaps of regions that are differentially accessible between trisomy 21 and euploid cells at promoter regions on chromosome 21. (B) Box plots for a log2 fold change of OCRs among chromosome 21 (chr21) and other chromosomes (nonchr21). (C) Volcano plot of differential ATAC peaks in trisomy 21 cerebral organoids. Differential ATAC peaks were identified by DESeq2. The color intensity represents the density of the points in the volcano plot. Increased ATAC sites are shown in orange (log2 fold change >1 and P < 0.05, n = 1785), and decreased ATAC sites are shown in blue (log2 fold change <–1 and P < 0.05, n = 1695). (D) Heatmap of transcriptome analysis shows 193 significantly DEGs in trisomy 21 organoids compared with euploid control organoids with a fold change of greater than 2 and q value of less than 0.05. DA, differentially accessible. (E) Correlations between gene expression (log2 fold change) and chromatin accessibility (log2 fold change). Pearson’s correlation coefficient r = 0.165. (F) GO analysis of the genes showing coordinately altered expression and accessibility between trisomy 21 and euploid organoids.

