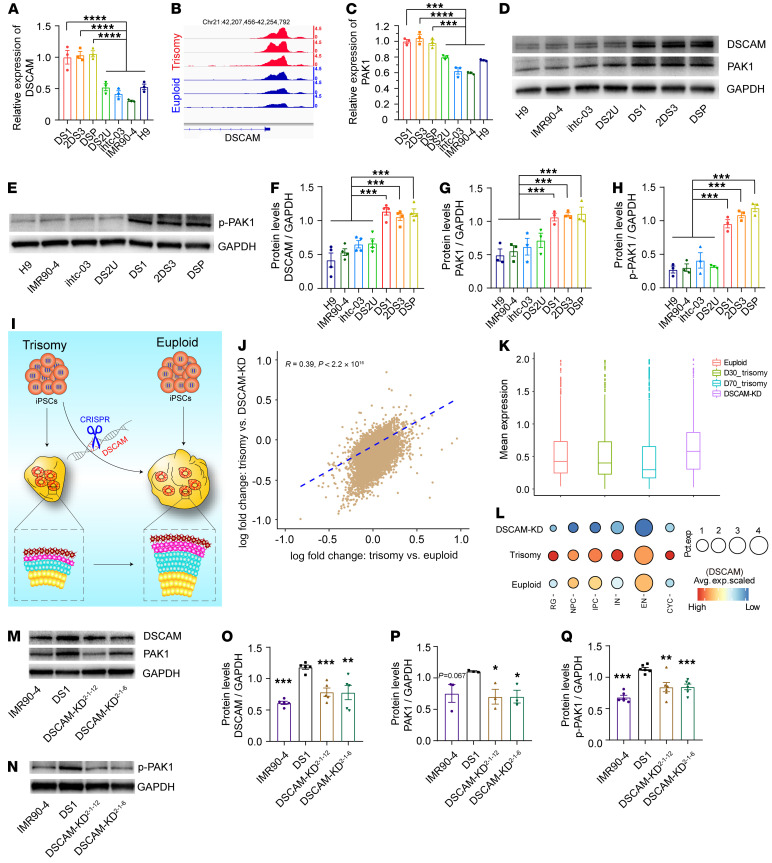
Figure 6. DSCAM-KD rescues impaired DSCAM/PAK1 signaling in DS-derived cortical cultures.
(A) Relative expression levels of DSCAM in day-30 trisomy 21 and euploid organoids as assessed by qPCR. (B) Coverage maps of normalized ATAC-Seq signals from trisomy 21 and euploid organoids showing a differentially accessible (DA) peak near the DSCAM gene on chromosome 21. (C) Relative mRNA expression levels of PAK1 in day-30 trisomy 21 and euploid organoids as assessed by qPCR. (D and E) Detection of DSCAM, PAK1, and p-PAK1 expression in trisomy 21 and euploid organoids on day 30, as assessed by Western blotting. (F–H) Representative quantitation of relative DSCAM, PAK1, and p-PAK1 protein expression in trisomy 21 and euploid organoids. n ≥3 independent experiments. Data represent the mean ± SEM. ***P < 0.001, by 1-way ANOVA followed by Dunnett’s multiple-comparison test. (I) Schematic diagram illustrating the effects of DSCAM KD on proliferation and neurogenesis in trisomy 21 and euploid cerebral organoids. (J) Correlations of the changes in expression between trisomy 21 organoids and DSCAM-KD organoids and between trisomy 21 organoids and euploid organoids. Spearman’s correlation coefficient: r = 0.39. (K) Box plot showing the average expression level of the trisomy 21–associated DEGs that were downregulated among trisomy 21, euploid, and DSCAM-KD cerebral organoids. (L) Dot plot showing DSCAM expression levels in multiple clusters among trisomy 21, euploid, and DSCAM-KD cerebral organoids. The size of each circle reflects the percentage of cells in a cluster where DSCAM was detected, and the color intensity reflects the average expression level within each cluster. (M and N) Representative Western blots of DSCAM, PAK1, and p-PAK1 levels in trisomy 21 and DSCAM-KD organoids. (O–Q) Representative relative quantitation of DSCAM, PAK1, and p-PAK1 expression levels in trisomy 21 and DSCAM-KD organoids. n ≥3 independent experiments. Data represent the mean ± SEM. *P < 0.05, **P < 0.01, and ***P < 0.001, by 1-way ANOVA followed by Dunnett’s multiple-comparison test.

