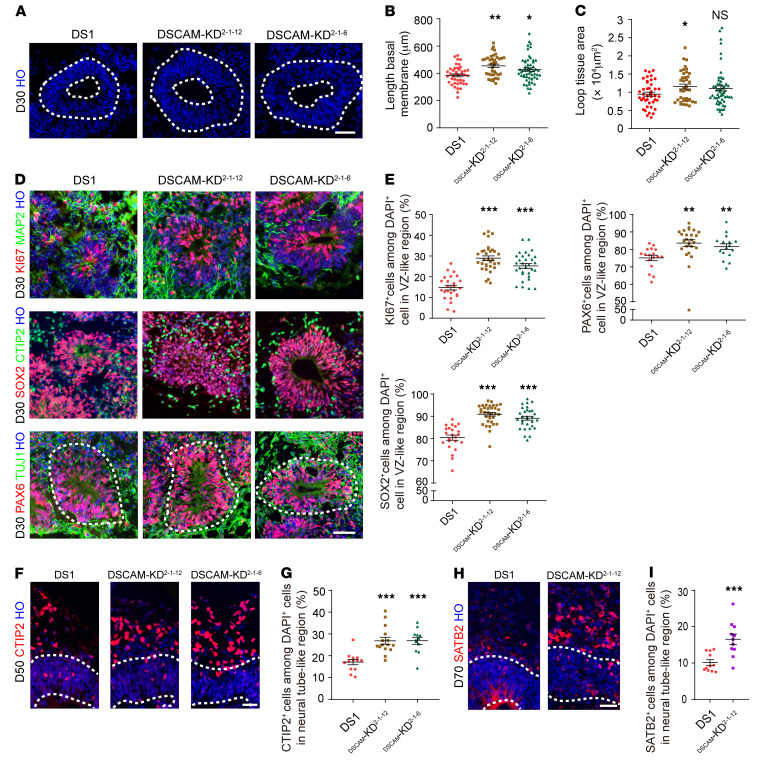
Figure 7. Knocking down DSCAM rescues abnormal neurogenesis in DS-derived cortical cultures.
(A) Representative images of day-30 organoids stained with Hoechst, which show the quantitation of the different parameters. Scale bar: 50 μm. (B and C) Quantitation of the basal membrane length and loop tissue area in the neuroepithelial loops of trisomy 21 and euploid organoids after 30 days of differentiation. Organoids (n ≥15) from 3 independent biologic replicate experiments were analyzed for each cell line. Data represent the mean ± SEM. *P < 0.05 and **P < 0.01, by 1-way ANOVA followed by Dunnett’s multiple-comparison test. (D) Representative images of day-30 trisomy 21 and DSCAM-KD organoids stained for Ki67, SOX2, PAX6, MAP2, CTIP2, and TUJ1 expression. Scale bar, 50 μm. (E) Quantification of the proportion of Ki67+, SOX2+, and PAX6+ cells in day-30 trisomy 21 and DSCAM-KD organoids. n = 17–33 VZ-like regions in at least 10 organoids per cell line. Data represent the mean ± SEM. **P < 0.01 and ***P < 0.001, by 1-way ANOVA followed by Dunnett’s multiple-comparison test. (F and G) Immunocytochemical staining and quantification of CTIP2+ cells in both trisomy 21 and DSCAM-KD organoids after 50 days of differentiation. n = 13–15 neural tube–like regions in at least 7 organoids per cell line. Data represent the mean ± SEM. ***P < 0.001, by 1-way ANOVA followed by Dunnett’s multiple-comparison test. Scale bar: 35 μm. (H and I) Immunocytochemical staining and quantification of the proportion of SATB2+ cells in both trisomy and DSCAM-KD organoids on day 70. n = 11 neural tube–like regions in at least 6 organoids per cell line. Data represent the mean ± SEM. ***P < 0.001, by Student’s t test. Scale bar: 35 μm.

