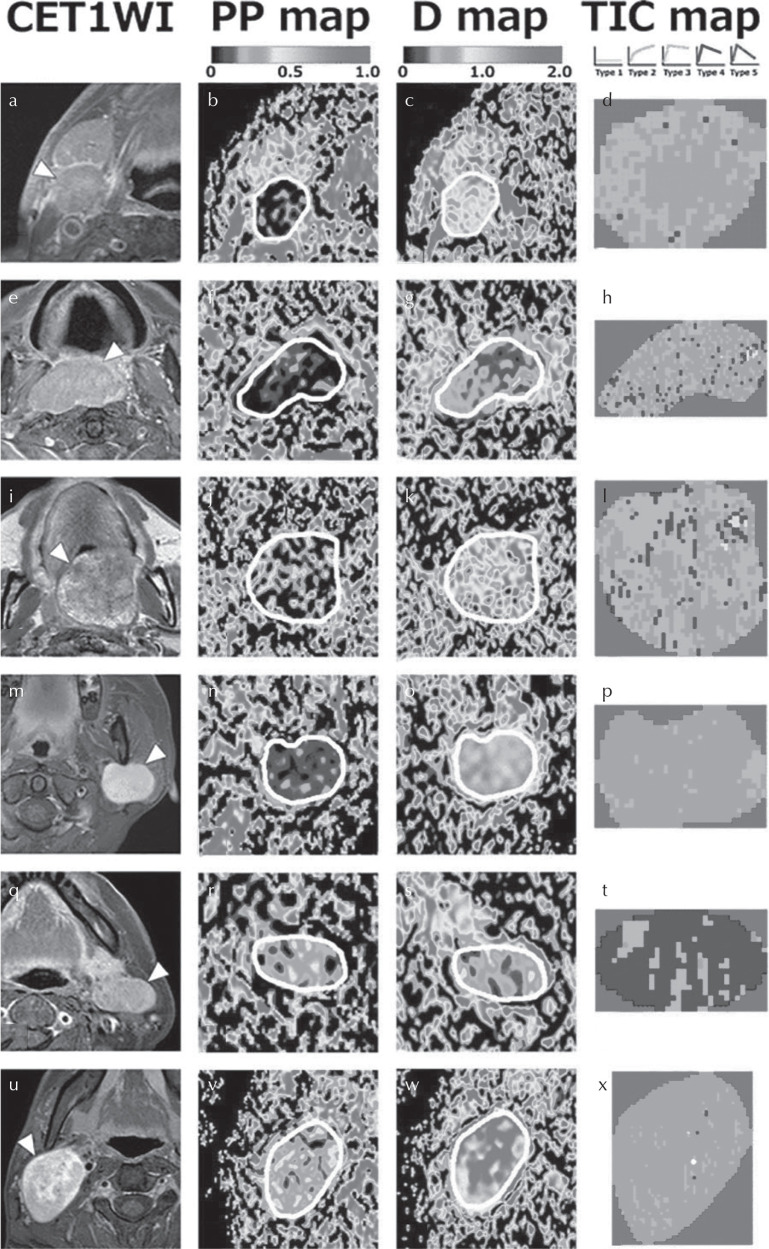
Fig. 3.
Representative contrast-enhanced T1-weighted MR images (CE T1WI) with (a, e, m, q and u) or without (i) fat-suppression, and PP, D, and TIC maps of a squamous cell carcinoma (SCC) node (a–d), lymphoma (e–h), carcinoma ex pleomorphic adenoma (i–l), pleomorphic adenoma (m–p), Warthin tumor (q–t), and schwannoma (u–x). (a–d) A 75-year-old man with an SCC node at level IIA (a), PP = 0.057 (b), D = 0.830 × 10⁻³ mm2/s (c), TIC profile = Type 2 (d). (e–h) A 79-year-old man with lymphoma in the oropharynx (e), PP = 0.04 (f), D = 0.435 × 10⁻³ mm2/s (g), TIC profile = Type 3. (i–l) A 59-year-old man with carcinoma ex pleomorphic adenoma in the palate (i), PP = 0.217 (j), D = 1.005 × 10⁻³ mm2/s (k), TIC profile = Type 3 (l). (m–p) A 34-year-old woman with pleomorphic adenoma in the left parotid gland (m), PP = 0.099 (n), D = 1.287 × 10⁻³ mm2/s (o), TIC profile = Type 2 (p). (q–t) A 63-year-old woman with Warthin tumor in the left parotid gland (q), PP = 0.227 (r), D = 0.485 × 10⁻³ mm2/s (s), TIC profile = Type 4 (t). (u–x) A 24-year-old man with a schwannoma (u), PP = 0.294 (v), D = 1.550 × 10⁻³ mm2/s (w), TIC profile = Type 2 (x). White demarcations on the PP and D maps indicate tumor areas. Adapted from Sumi et al.71

