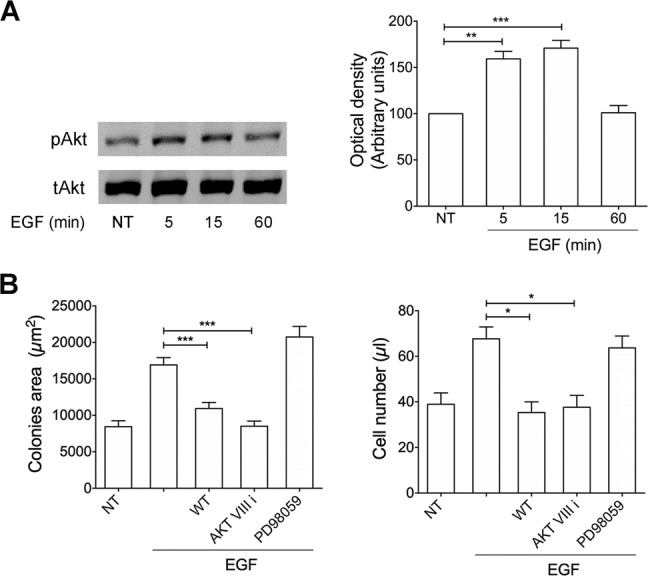
Fig. 4. EGFR triggering is linked to PI3K/Akt signaling pathway activation.

A Raji cells were stimulated with 100 ng/ml of EGF at 37 °C for the indicated times. Not treated cells (NT) were used as control (lane 1). Western blot analysis of Raji lysates shows that EGF ligand activates Akt, as shown by the respective phosphorylation state, verified by densitometric analysis and plotting of the phospho-Akt/total Akt (pAkt/tAkt). In the left panel blots from one representative experiment of 3 with similar results are shown. In the right panel, values reported for Akt phosphorylation are the mean ± SD of three independent experiments. Statistical analysis was performed by one-way ANOVA and the Bonferroni’s post-test was used to compare data. B Raji cells were cultured for 8 days in the presence or absence of EGF (100 ng/ml) and PI3K inhibitor WT (100 nM) or Akt inhibitor VIII (1 μM) or MEK/ERK1/2 inhibitor PD98059 (10 μM) The colony area was measured (15 colonies/condition) by using Leica Qwin image analysis software (left panel). The same number of colonies (15 colonies/condition) was aseptically harvested from 96-well plates and stained with propidium iodide (PI) to detect PI-viable cells by flow cytometry. Absolute cell counts were obtained by the counting function of the MACSQuant® Analyzer (right panel). Bars represent the means ± SD of three independent experiments. The statistical significance between control and treated cultures was calculated using one-way ANOVA and the Bonferroni’s post-test was used to compare data. *P < 0.05; **P < 0.01; ***P < 0.001.
