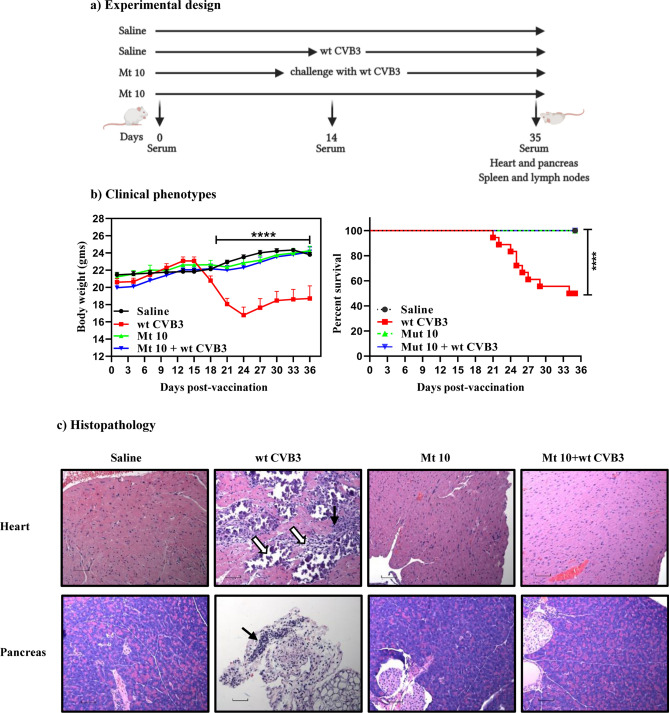
Figure 4.
Mt 10 virus offers protection against wt CVB3 infection in challenge studies. (a) Experimental design. Two groups of mice each were administered saline or Mt 10 virus on day 0 after serum was collected. After 14 days, serum was collected, and one group from each was challenged with CVB3. Experiments were terminated 21 days later, and serum and tissues were collected for in vitro experimentation. (b) Clinical phenotypes. Body weights (left panel) and survival rates (right panel) between different groups are shown. (c) Histopathology. Hearts and pancreata collected from the indicated groups and processed by H and E staining to evaluate inflammatory changes. Representative heart (top panel) and pancreatic (bottom panel) sections are shown. Heart sections from wt CVB3 group shows infiltrations (solid arrow) and mineralization, necrosis, and fibrosis (empty arrow). Pancreatic sections from wt CVB3 group had infiltrations (solid arrow) as opposed to normal sections in the saline, Mt 10 virus, and Mt 10 virus/wt CVB3-challenged groups. Magnification, 20×; scale bars, 20 µm. Data sets obtained from three individual experiments, each involving n = 3 to 8 mice, are shown. Two-way ANOVA with a Sidak’s post-test was used to compare body weight changes in vaccine and saline groups relative to wt CVB3 group. Log-rank test with Bonferroni correction was used to compare survival curves. ****p ≤ 0.0001.

